

Sandbox
A sandbox is an isolated environment where you can send and inspect traces while you build. Point your agent at a sandbox from your dev or staging environment and watch exactly what it did in Latitude’s traces UI — without your development traffic ever touching your production dashboards, billing, or alerts. A sandbox is deliberately minimal and focused on trace-level debugging: it ingests and shows your traces, and nothing more. It mirrors your organization’s project layout but holds completely separate data — your development traces.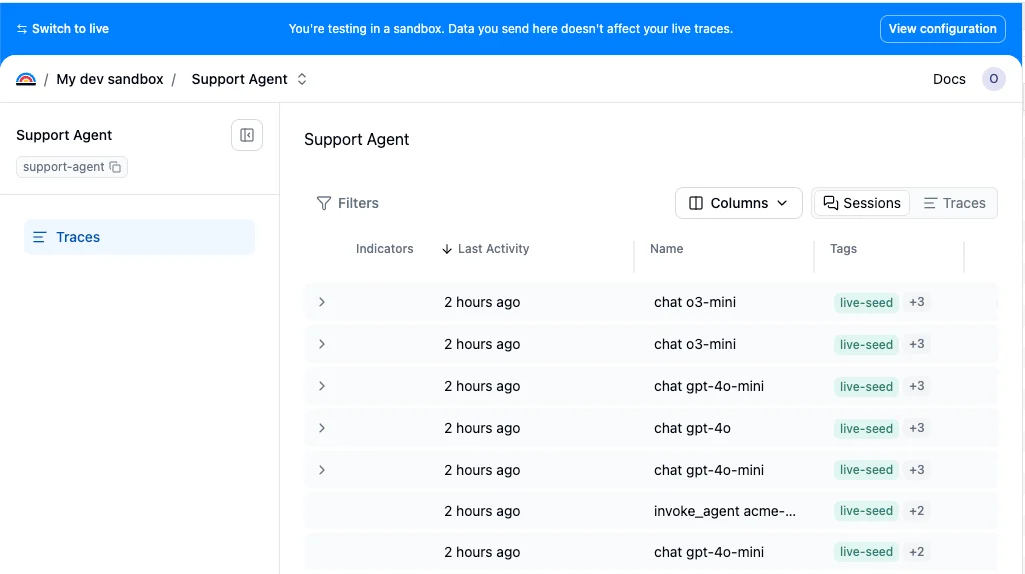
Switching to a sandbox
Your organization has a single sandbox. Flip the Sandbox toggle in the sidebar to switch into it — the first time, Latitude creates your sandbox and a sandbox copy of the project you’re currently in; after that, the toggle just takes you there (and mirrors any new project you switch from). While you’re in a sandbox, a blue banner across the top makes it unmistakable which environment you’re in, and Switch to live takes you back.
What’s available in a sandbox
A sandbox is intentionally light. It gives you the full trace-level debugging experience — the Traces and Sessions list, grouping, sorting, filters, and per-trace detail (duration, tokens, spans, model, status). The production monitoring layer is not available in a sandbox. The following features do not run on sandbox traces, by design:- Semantic and saved searches
- Monitors and alerts
- Signal detection and clustering
- Evaluations, annotations, and flaggers
- Outbound notifications (email, Slack, webhooks) — a sandbox never reaches an external channel, so your experiments can’t page teammates or hit customer alert channels
Using the same project identifiers as production
You instrument your code with the same project names everywhere — the API key decides where the traces land. Inside a sandbox you add the production projects you want to debug (which links them by stable id), or create sandbox-only projects for prototyping. The only thing you change when developing against a sandbox is the API key. Each sandbox gets its own key, prefixedlat_sandbox_ so it’s easy to spot in code, logs, and review. Find it inside the sandbox, under Sandbox configuration (it’s also shown on the traces empty state, next to the project slug) — the keys listed under Settings → Keys belong to your live organization, never to the sandbox.
Querying a sandbox from the CLI or an agent
The samelat_sandbox_ key also reads the sandbox over the API and the CLI — the key alone decides which environment you’re talking to, on reads exactly as on writes. So an agent can pull a dev trace and investigate it, instead of you pasting screenshots:
-p picks the environment for each command. For a one-off shell or a CI job, export LATITUDE_API_KEY=lat_sandbox_... works too.
Two things follow from the key being the boundary:
- Your live key reads only live data. For a project the sandbox mirrors, the query that works in the sandbox comes back as an empty page under a live key; for a sandbox-only project, it’s a
404, because that slug doesn’t exist in your live organization. Either way, if your development traces look invisible from the API, check the key prefix first. - A sandbox key is an ordinary organization-scoped key, not a trace-only one — the whole API surface is reachable with it. What a sandbox lacks is the data the monitoring layer would have produced: no detected signals, no search index, no monitor or evaluation results. Those endpoints answer empty (or
404on a point lookup) because nothing ran, not because they’re blocked.
Differences from production
Rate limit
Sandbox keys have their own, lower ingest rate limit (60 requests/min, 64 MB/min). Pointing real production traffic at a sandbox key fails loudly and immediately with a
429 — a clear signal to fix the key.Retention
Sandbox traces are short-lived — spans are retained for 7 days and then age out. A sandbox is for active debugging, not long-term storage.
Billing
Sandbox usage is completely free. Sandbox traces are never metered or charged and never touch your credit balance. Abuse is bounded by the rate limit and a per-period span quota instead.
Span quota
Sandbox ingestion is bounded by a per-period span quota that scales with your plan: 100,000 spans on Free, 1,000,000 spans on Pro, and unlimited on Enterprise.
Sleep and reactivation
A sandbox is put to sleep (archived) after 7 days of inactivity. Sleeping sandboxes hold no live capacity. Sending traces to a sleeping sandbox is rejected with a403 (mirroring how an out-of-credits production org behaves) — nothing is silently accepted, and the sandbox isn’t silently revived. To wake it back up, open the sandbox and press Activate in the banner (which turns gray while the sandbox is asleep) to resume ingestion.
Related
- Environments: Separate dev, staging, and production traces with tags or metadata
- Start tracing: Instrument your agent and send traces to Latitude
- Traces: The traces UI you use inside a sandbox