Tools
The Tools page lists every tool your agents define and call, aggregated from your telemetry. Use it to spot tools that are failing, slow, or never used — no extra instrumentation needed beyond the tool calls and definitions already present in your traces.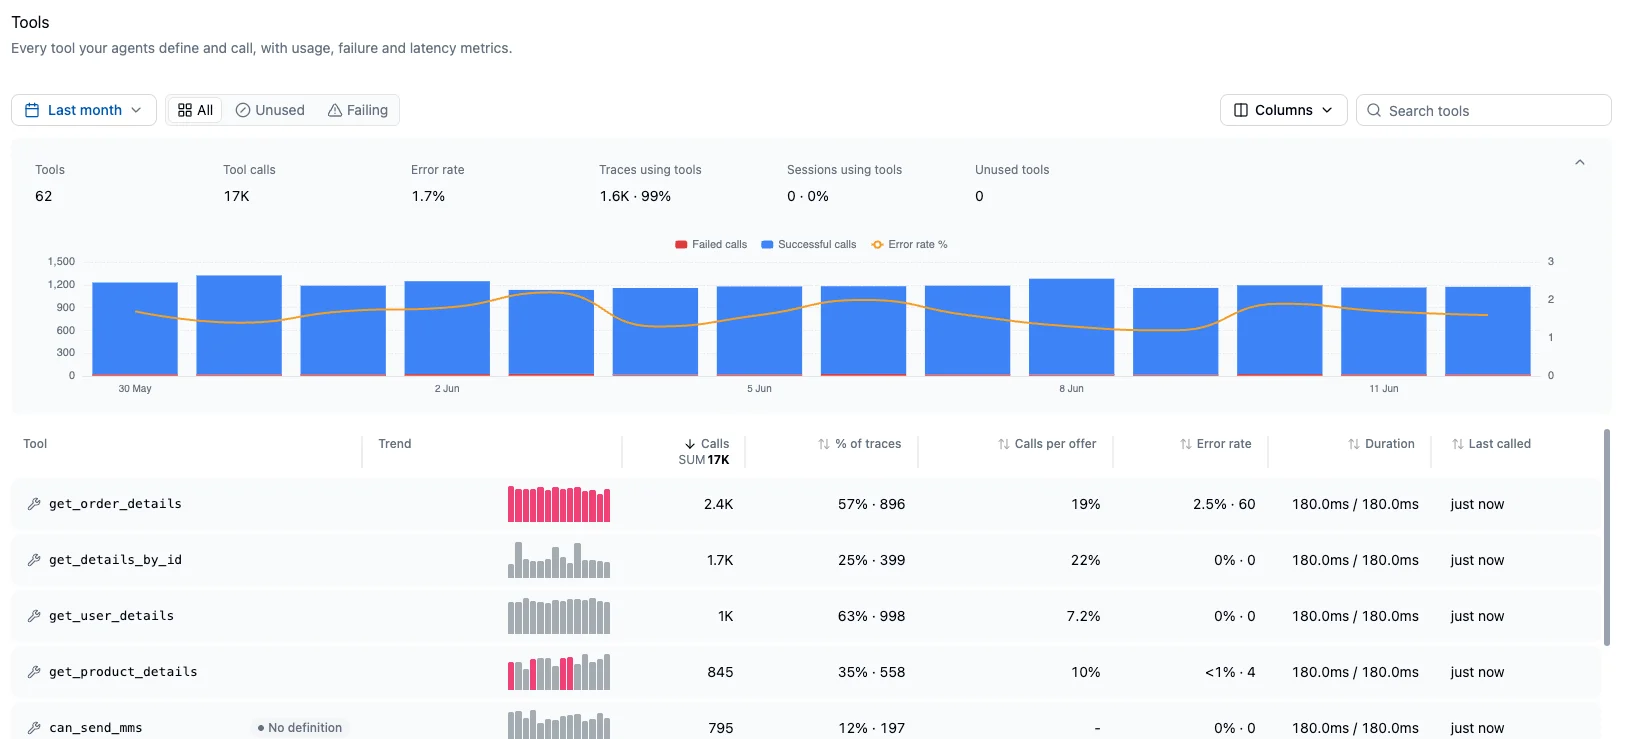
The tools dashboard
The dashboard opens with aggregate metrics for the selected time range — tool count, total calls, error rate, the share of traces and sessions using tools, and how many tools went unused — above a histogram of successful and failed calls with the error rate overlaid. Below, the table shows one row per tool:- Trend: a per-tool sparkline of successful and failed calls
- Calls: call volume, with a column-wide SUM rollup
- % of traces: the share and count of traces that called the tool
- Calls per offer: how often the model calls the tool across the chat turns that offered it. Can exceed 100% when a single turn calls it multiple times, and requires tool definitions on chat spans.
- Error rate: the rate and count of failed calls
- Duration: p50 / p95 call duration
- Last called: most recent call in the period
Tool detail
Open a tool to see its usage stats, calls over time, and latency over time. The parameters panel shows the most frequent values per parameter across recent calls — useful for spotting malformed or repeated inputs — and the context panel shows which tools and tags co-occur in the same traces. Recent calls list each invocation with its status, duration, input, output, and a link to the trace it belongs to.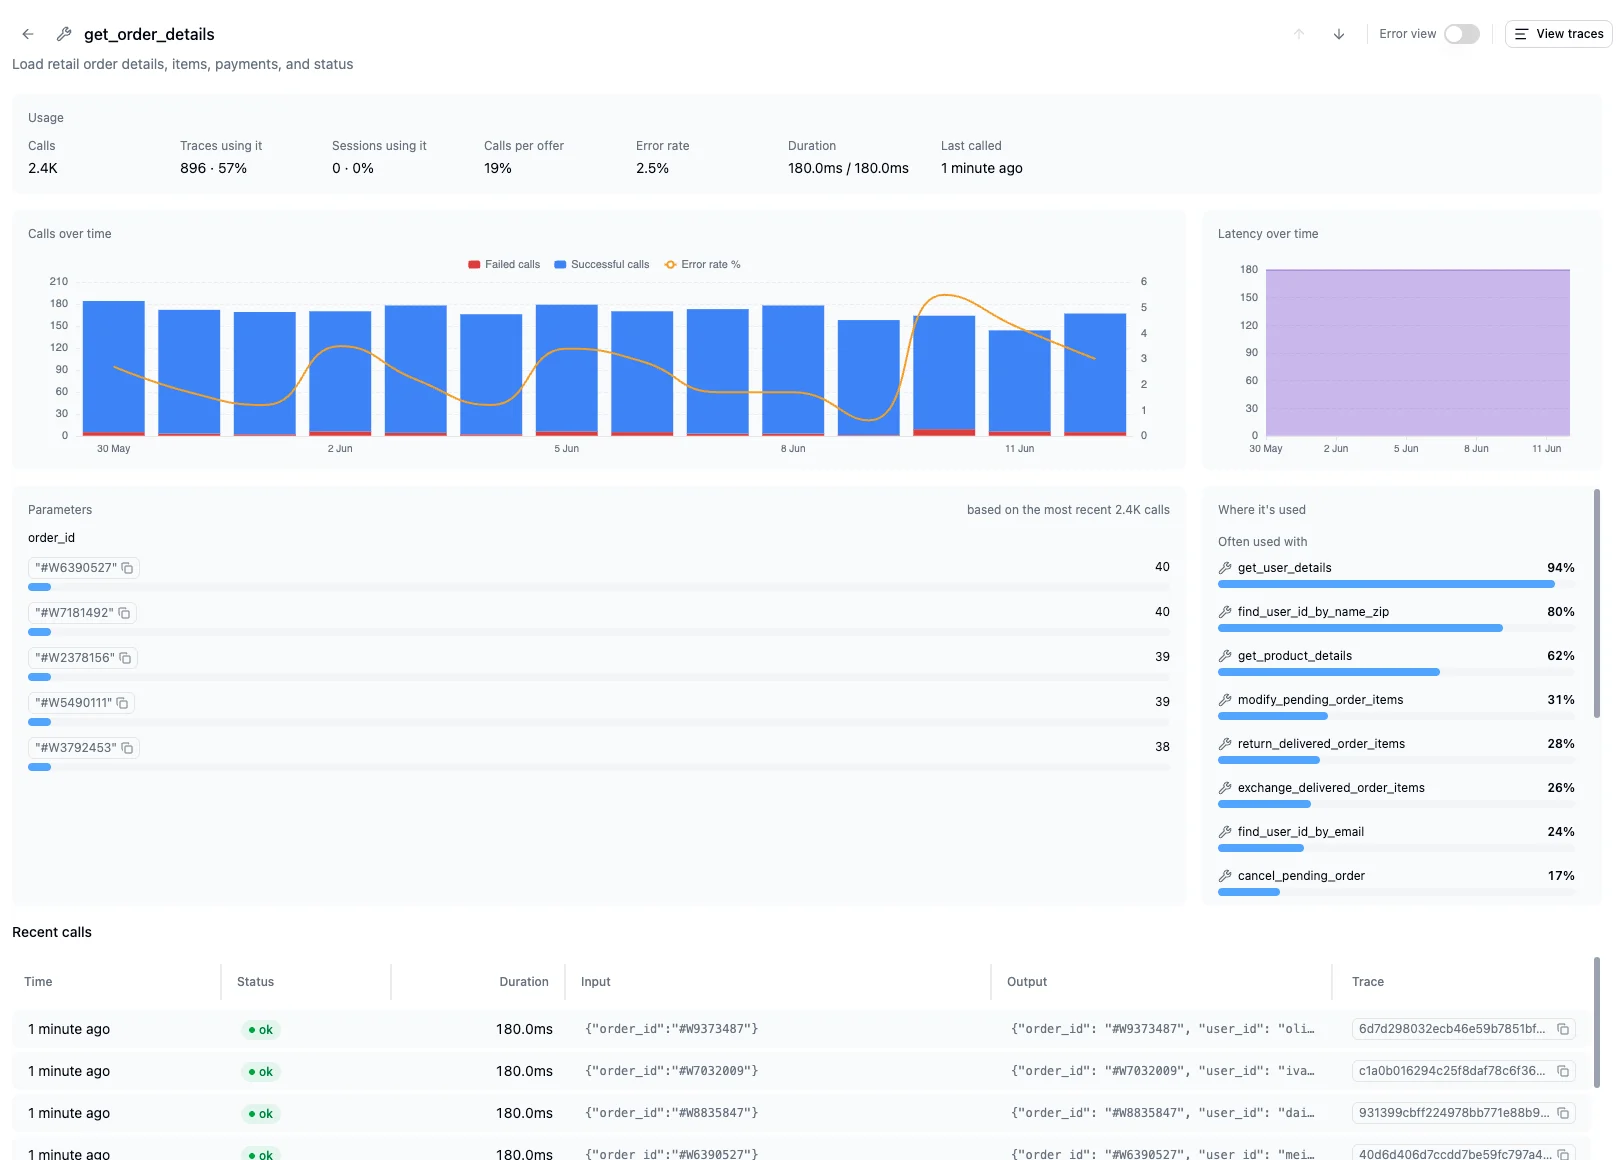
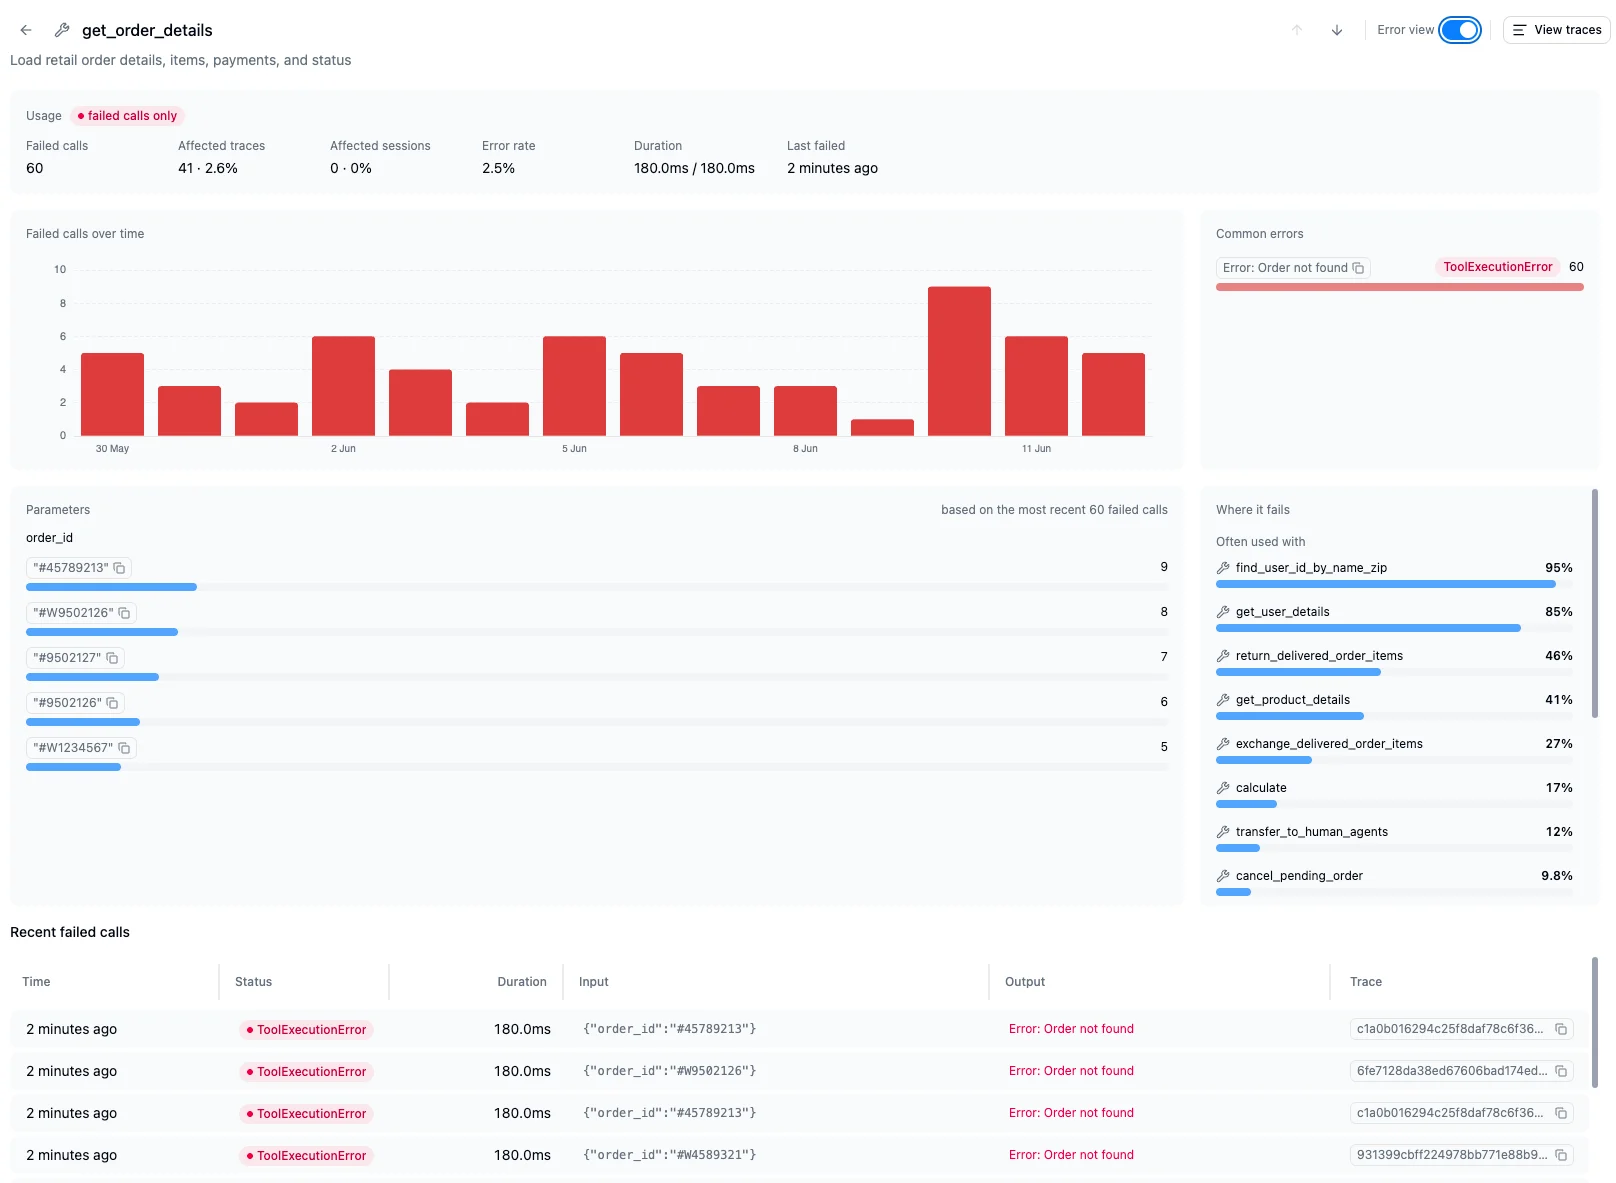
Error view
Toggle the error view to scope the whole page to failed calls: failed calls over time, common errors grouped by message and error type, the parameter values seen on recent failures, the tools it fails alongside, and the recent failed calls with their error output.