

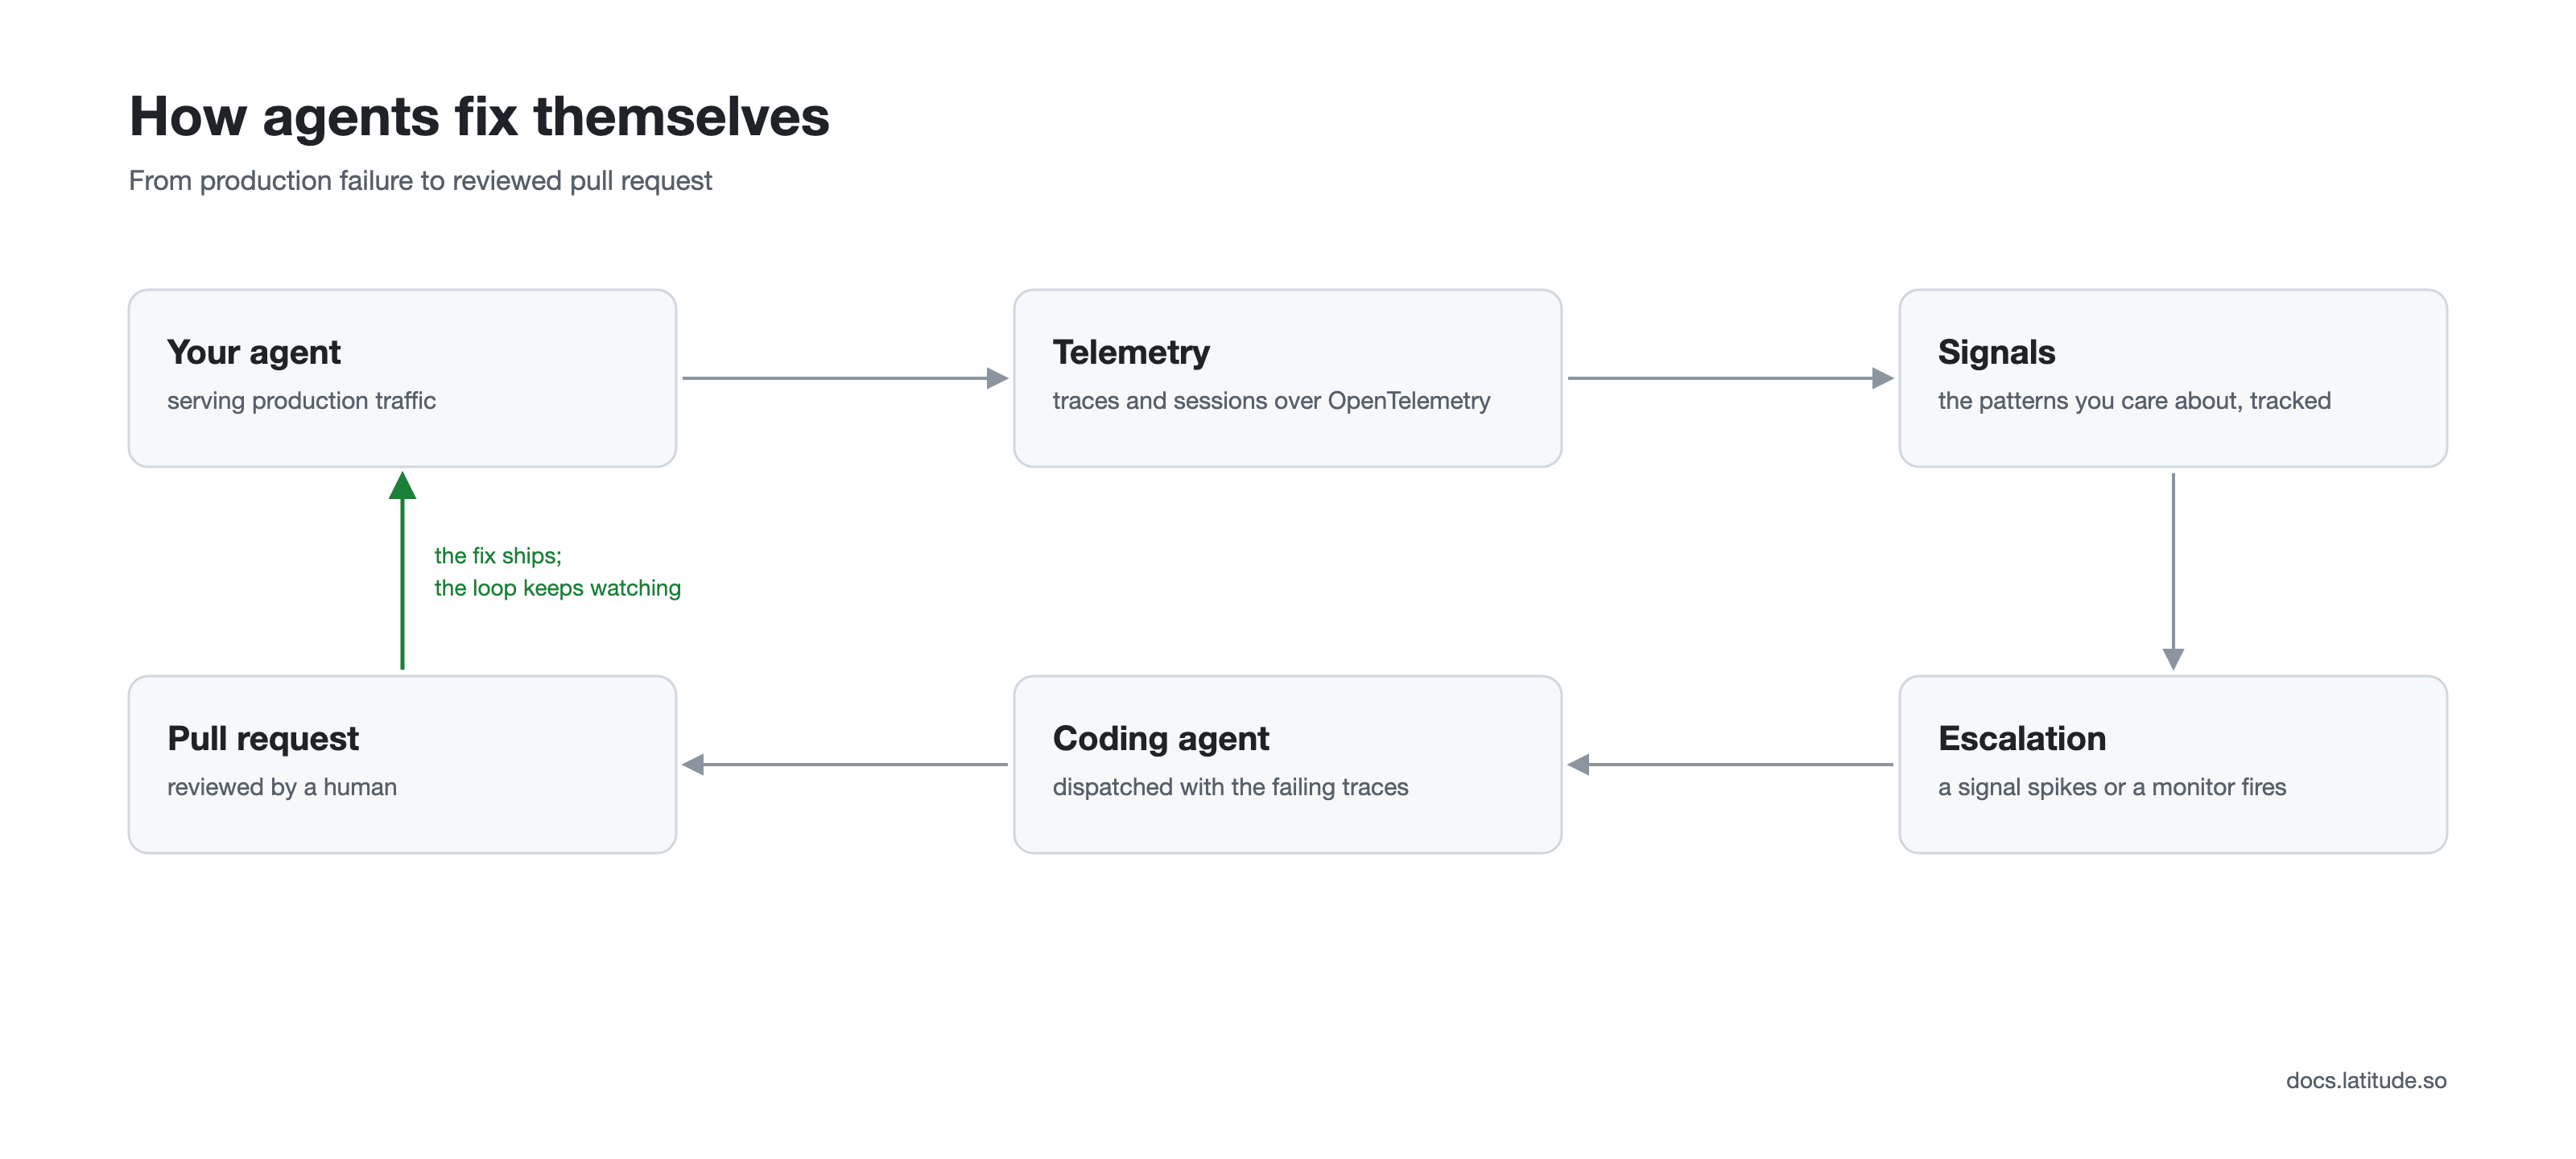
The self-healing loop, from production failure to reviewed pull request.
How the loop closes
1
Detect failures in production
Connect telemetry so every interaction arrives as a trace and multi-turn conversations group into sessions. Find failures with Search when you can describe them, or let Behaviors surface the topics and trends you would not think to look for. Annotations and flaggers record what you find, and Latitude groups those into named, tracked signals.
2
Score live traffic continuously
Give a signal an evaluation, a script that can combine code rules, semantic similarity, and LLM judgment, and live traffic is scored as it arrives. The evaluation’s trigger controls how much: generated evaluations start at a 10 percent sample, so raise the sampling and adjust the filters if the signal needs full coverage. Evaluations generated from your annotations carry an alignment record, so how often the script agrees with a human reviewer is a measured number.
3
Escalate what is growing
A signal escalates when its recent occurrences clear its own weekly rhythm, and monitors extend the same mechanism to saved searches and raw traffic metrics such as cost, latency, or cache hit rate. Either one opens an incident.
4
Dispatch your coding agent
With agent dispatch configured, an escalating signal or an open incident wakes your coding agent with a prompt, a deep link, and sample failing traces. Latitude is the trigger and the context provider, not the agent runtime: the dispatched agent runs in your environment, with your credentials, against your repository. Direct integrations exist for Claude Code, Cursor, and Linear, with webhooks for everything else.
5
Verify the fix and lock it in CI
The dispatched agent investigates through the MCP server, reading the signal, slicing occurrences, and reading the failing conversations, then opens a pull request. Turn the failing traces behind the signal into a dataset and add a regression test that replays it in CI, so the fix has to pass before it merges and every later prompt change is checked against the same failure. With the GitHub integration connected, the merge itself resolves the signal: a pull request that references the signal’s slug closes it on landing, and a revert reopens it.
Where humans stay
Two points of the loop are human by design. Annotations are the ground truth that evaluations are aligned against, and a person reviews every pull request before it merges. Everything between those points, finding examples, reconstructing context, and carrying trace ids between tools, is what the loop automates.Set it up
- Start tracing one production agent.
- Annotate a handful of real failures, or let flaggers do it.
- Generate an evaluation for the signal that matters most.
- Add a monitor for any metric you cannot afford to miss.
- Configure agent dispatch under Settings → Integrations.