

Not emitting memory operations yet? See Memory tracing
to instrument your agent, then come back here to explore the data.
How it works
Memory operations arrive as ordinary spans through your existing tracing setup. Shortly after a trace completes, Latitude materializes them into a versioned ledger: each write stores the record’s full new body, versions are ordered by span end time, and the most recent write wins. Diffs and token counts are derived from those versions, so you get history and diffs without your memory provider having to support them. Record bodies, diffs, and token counts appear when your instrumentation captures content. With content capture off, Latitude still records each operation with its store, record, and counts, but not the bodies or diffs.The Memory page
The Memory page lists every store, one row per store, with its record count, write and read activity, and when it was last active.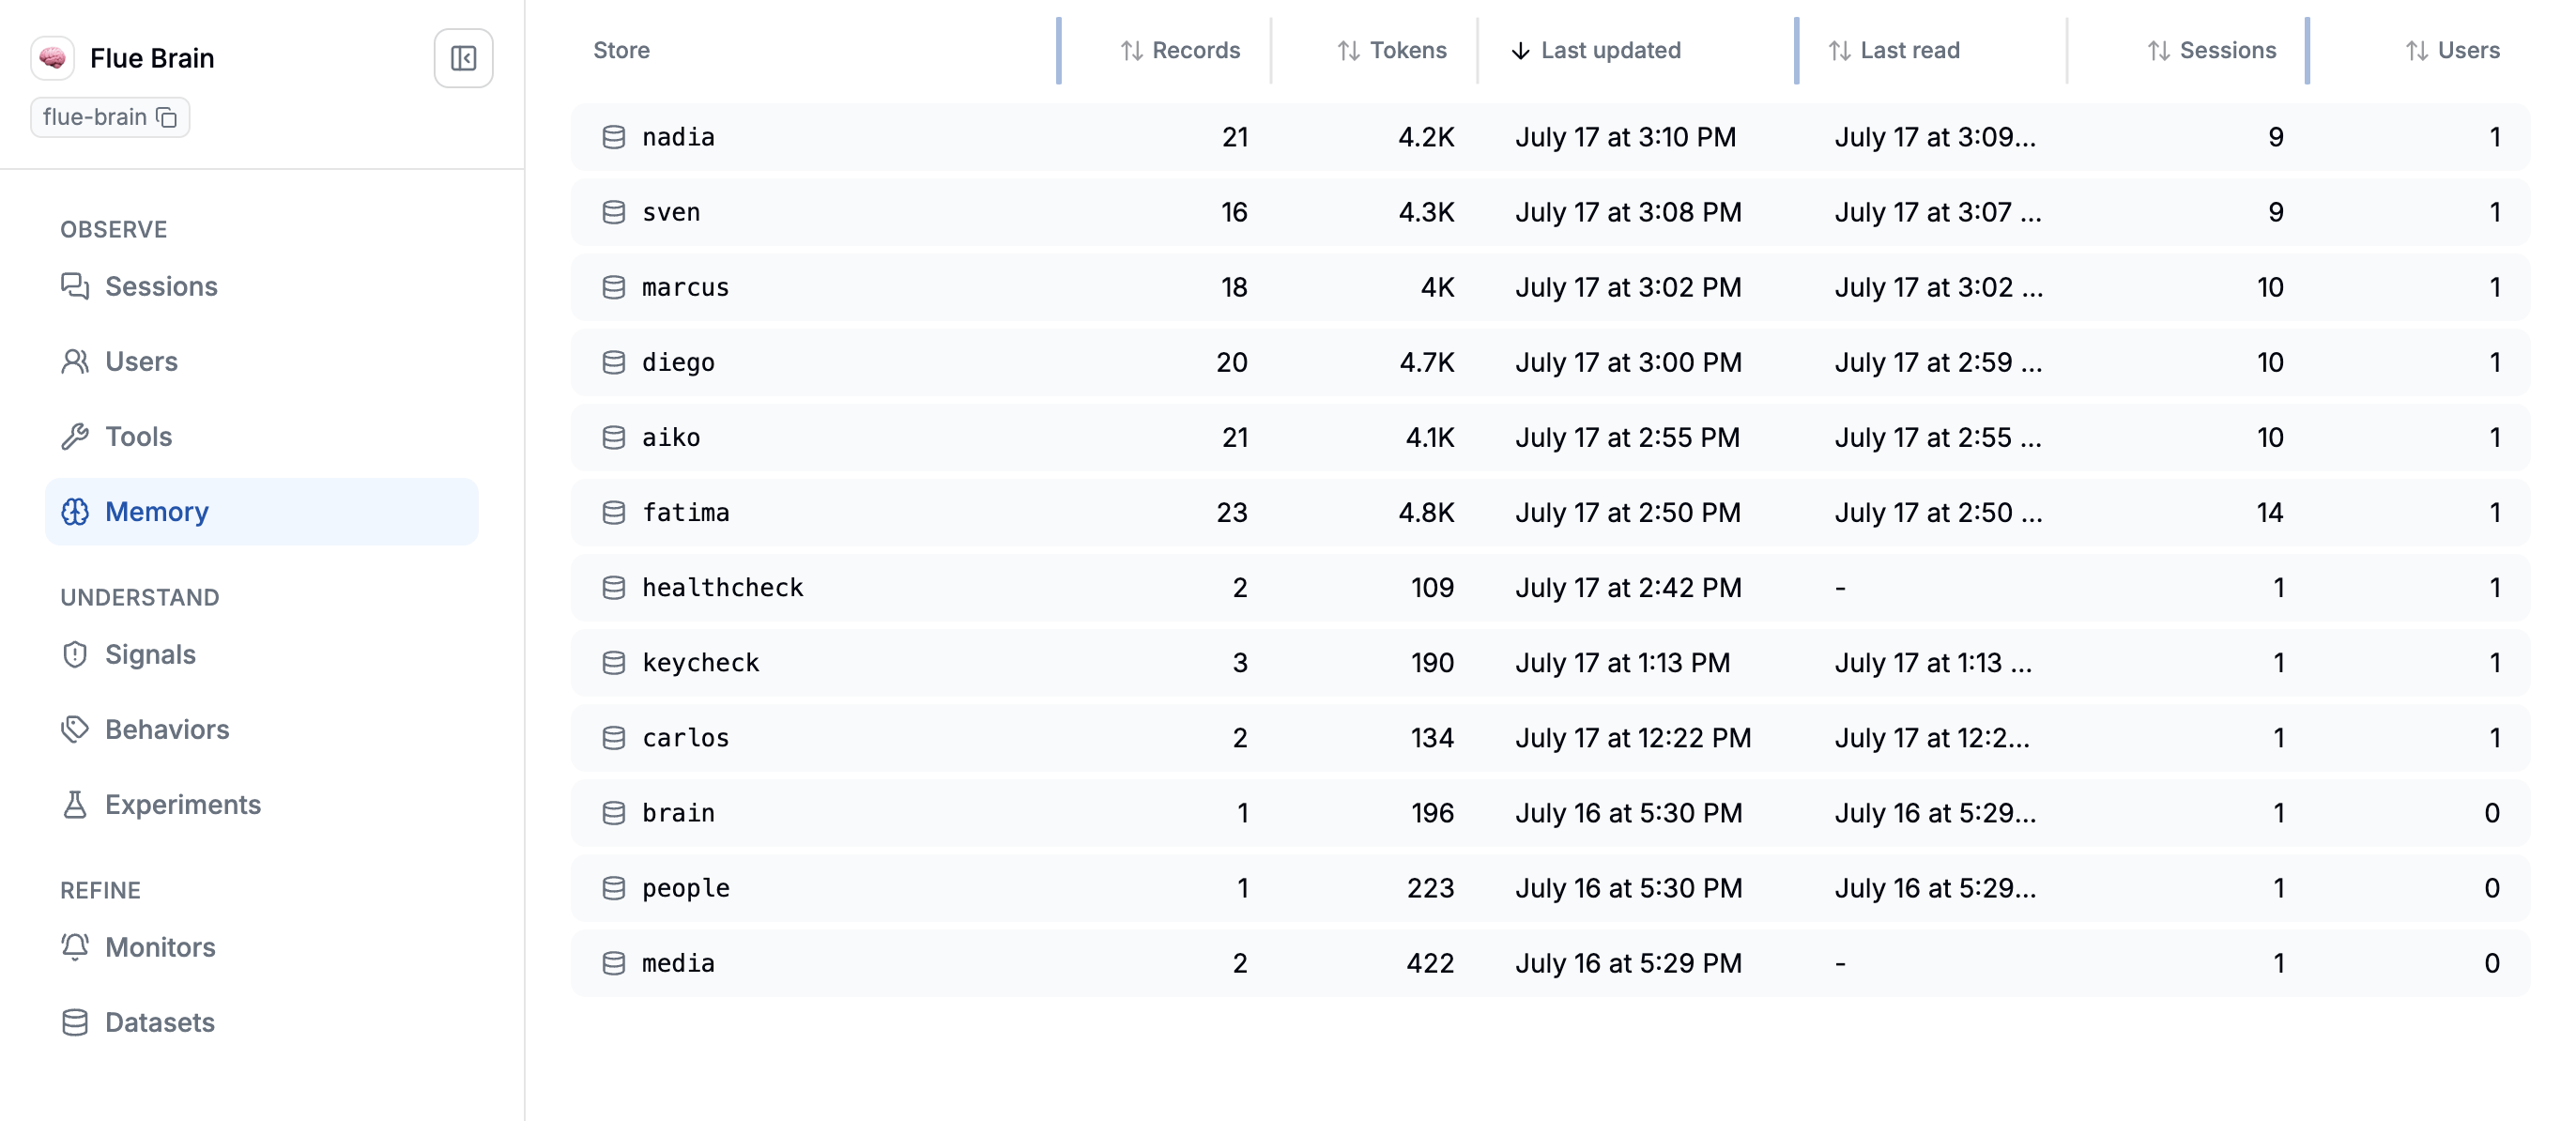
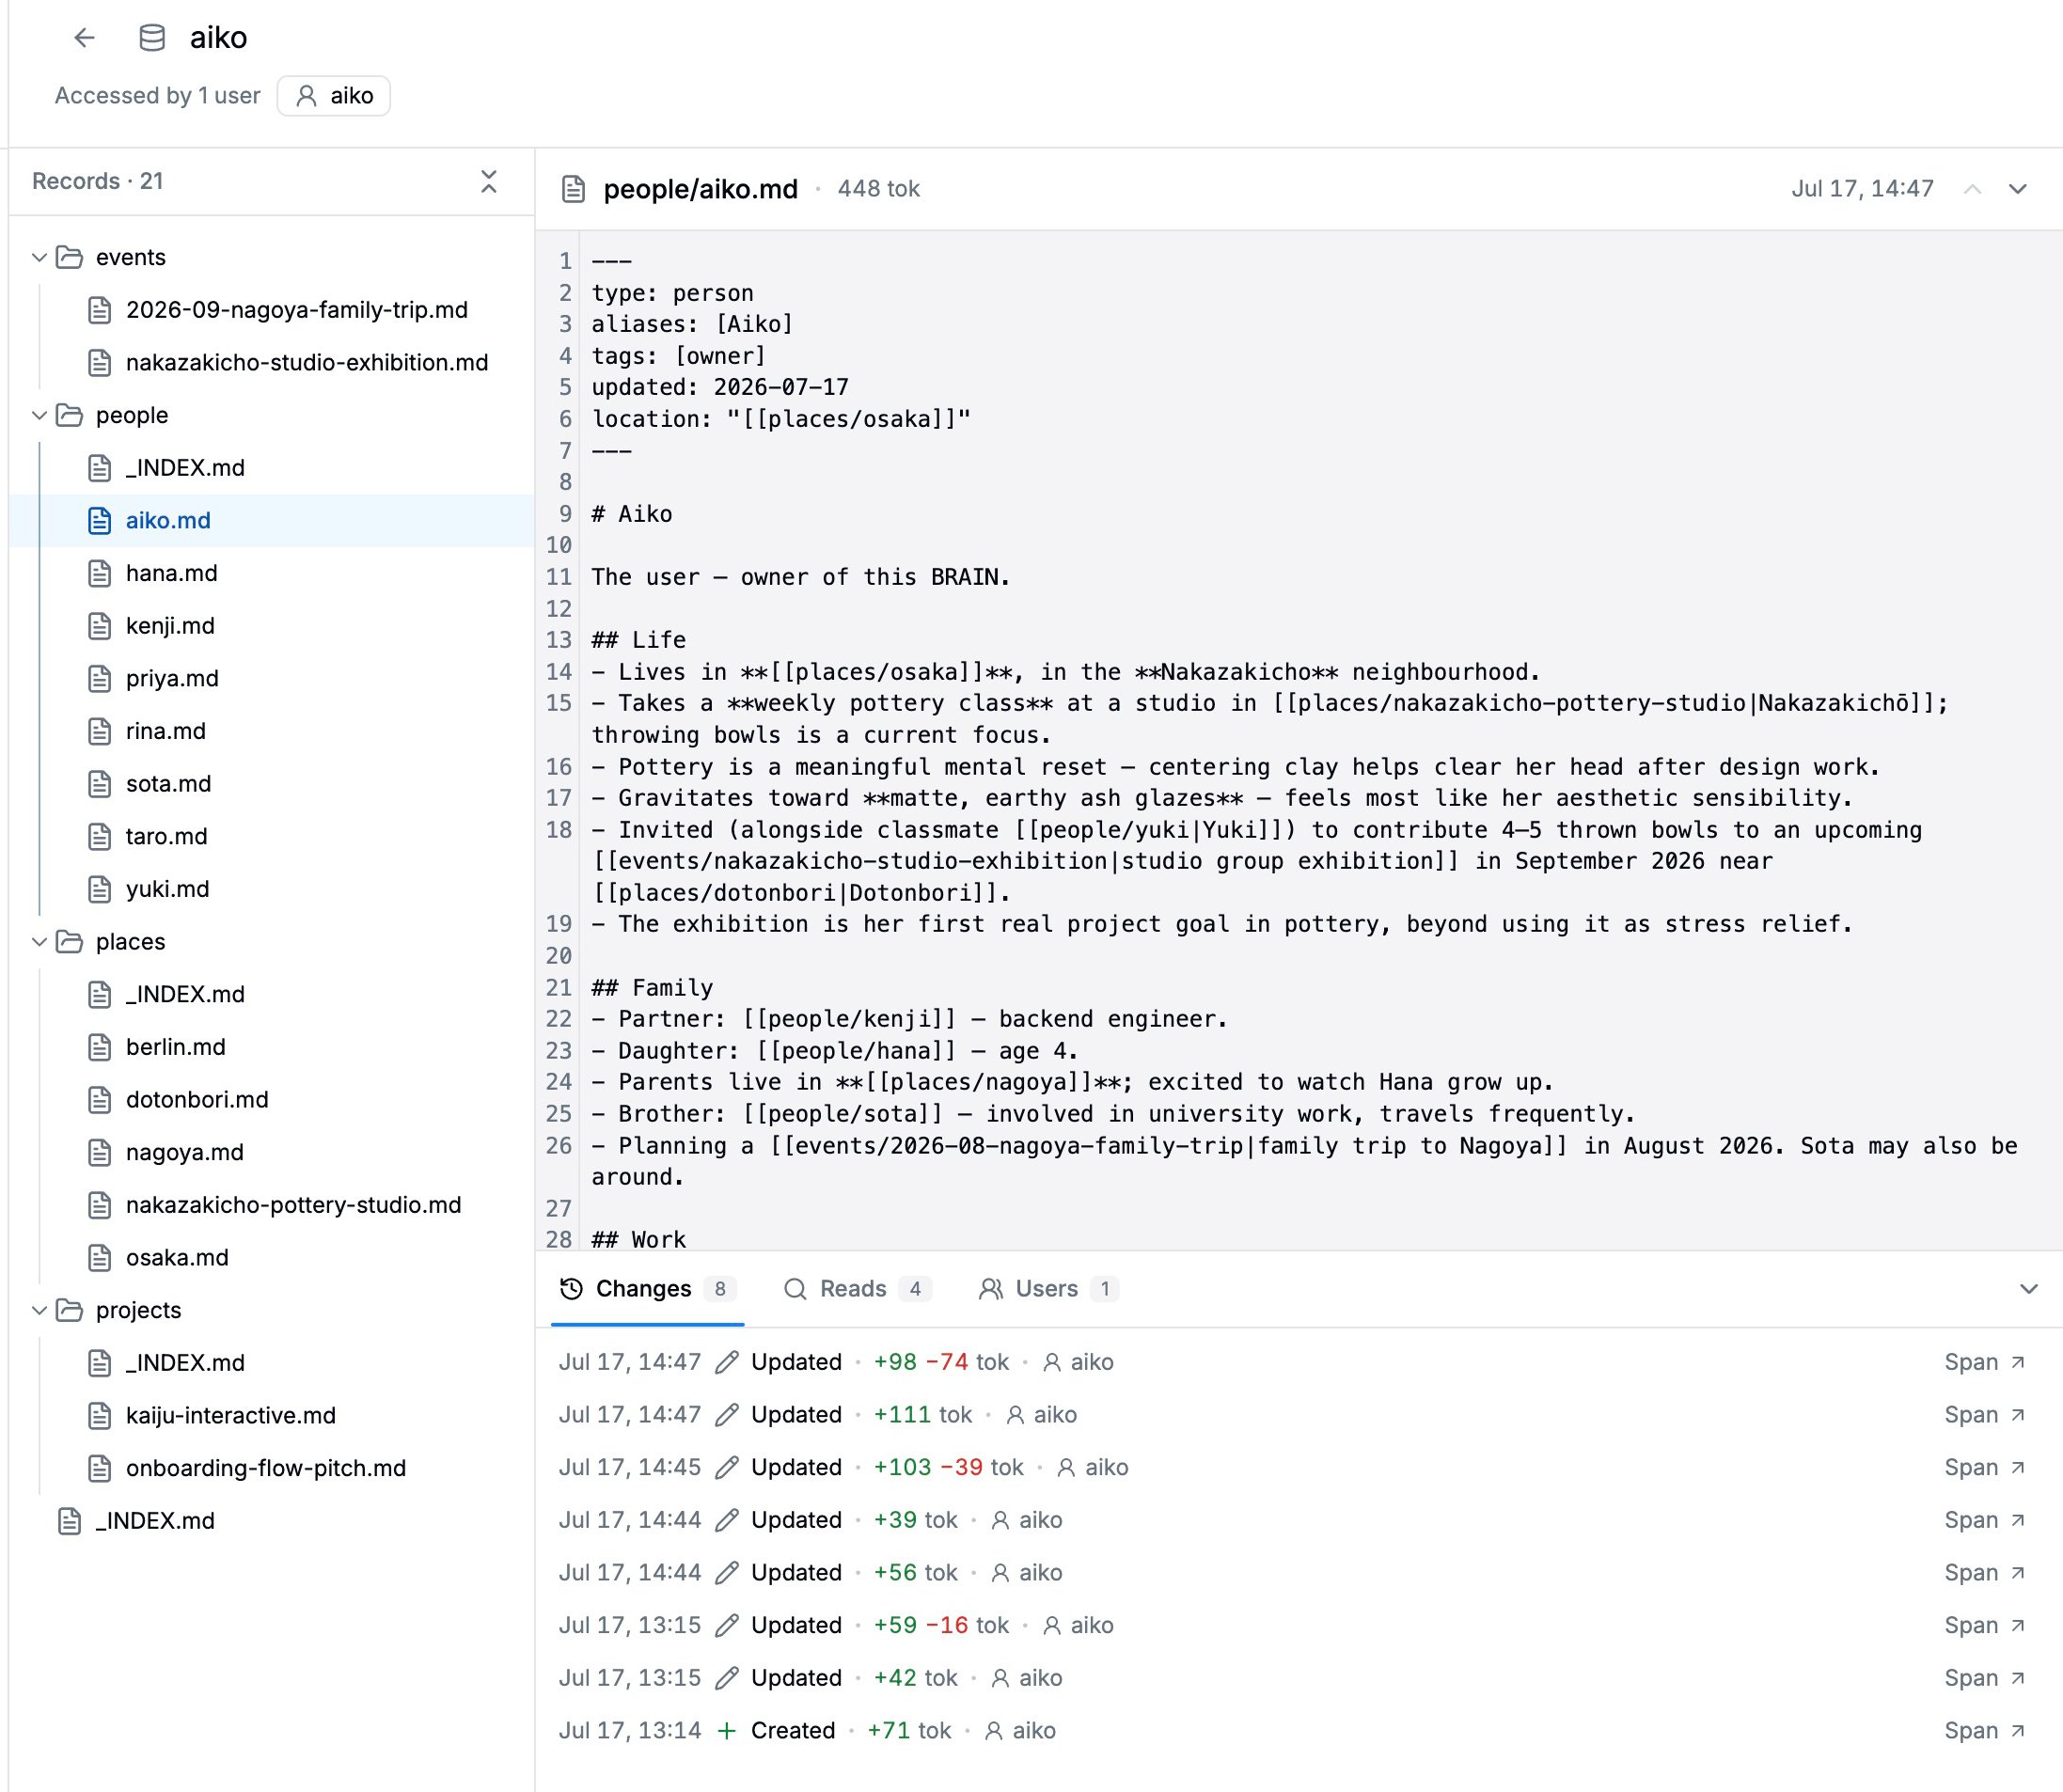
/ to form folders, the center pane shows the selected record’s current body, rendered as JSON when it parses as JSON, and the header lists the users who accessed the store, each linking to their user page.
Store dashboard
Until you select a record, the store shows its Dashboard, store-level analytics grouped into four questions. What’s used lists the most-read records and the cold storage nothing has touched in over a week. What agents look for lists the top search queries and the zero-hit queries whose latest search still returned nothing, which is where missing memory shows up. Write health counts thrash writes (repeats within a run), no-op rewrites that saved byte-identical content, and duplicate records, with a per-record table that also flags reverted records whose content went back to an earlier value. Footprint charts the store’s total tokens over time, its largest records, and the size distribution of live records.Record activity
Below a record’s content, the Record Activity panel shows everything that happened to it, across three tabs:- Changes: the record’s write history. Each row shows when it was created, updated, or removed, the token delta of that change, and the user behind it. Clicking a row opens the change’s diff, and each row links to the span, and to the session or trace it belongs to.
- Reads: every time the record was retrieved, with the search query that matched it, the tokens returned, and the user.
- Users: a per-user roll-up of reads and writes on this record, each row linking to the user’s page.
Change diffs
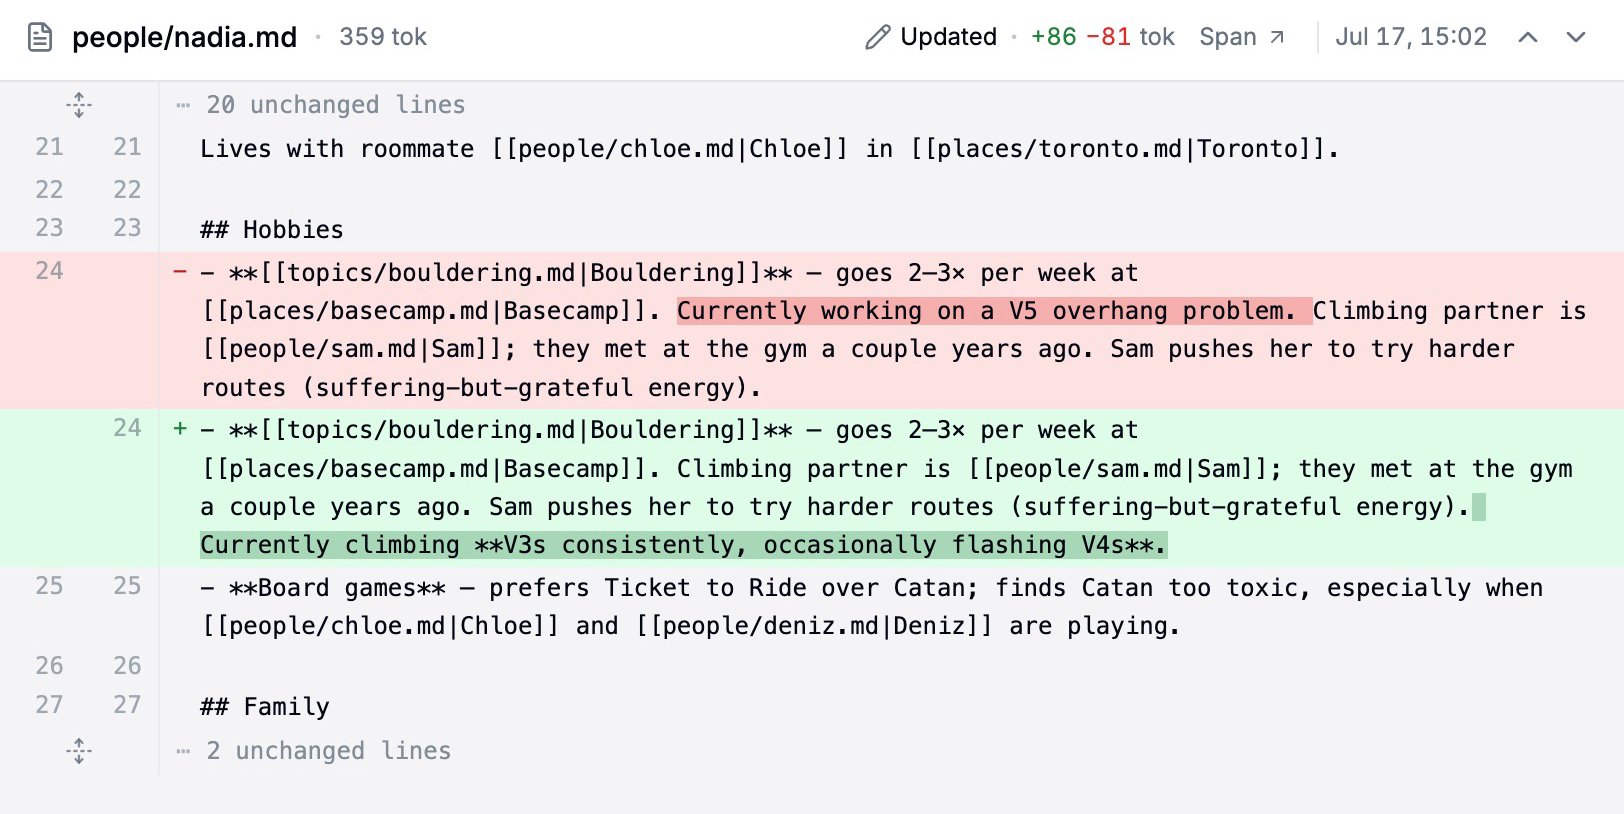
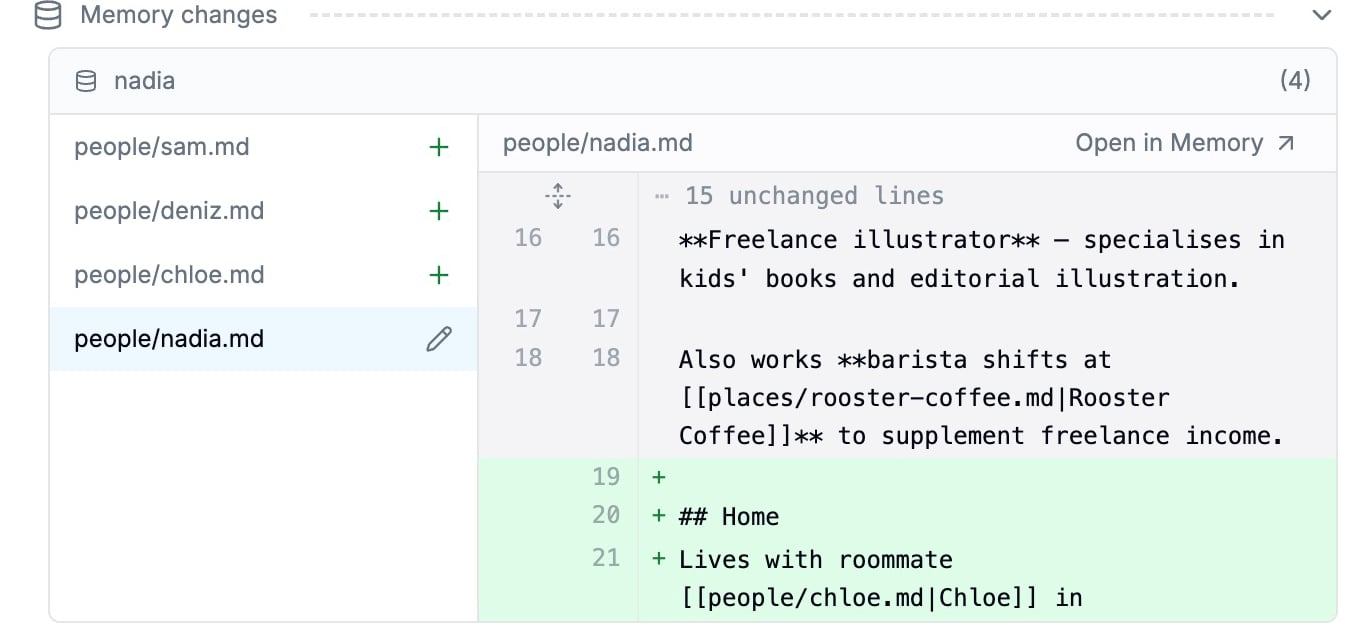
Selecting a change on the Changes tab swaps the content pane for a GitHub-style unified diff of that version against the previous one, with per-word highlighting and a+added −removed token summary. Arrow controls step to newer and older changes, and the selected change is shareable by URL, so you can link a teammate straight to the write that corrupted a record.
Memory on traces and sessions
Trace and session detail views include a Memory row summarizing the interaction’s memory footprint: tokens read, added, and removed. Hovering it expands a per-record breakdown grouped by store. The added and removed numbers compare each record’s body before and after the interaction, so a record written twice in the same session counts once, by its net change.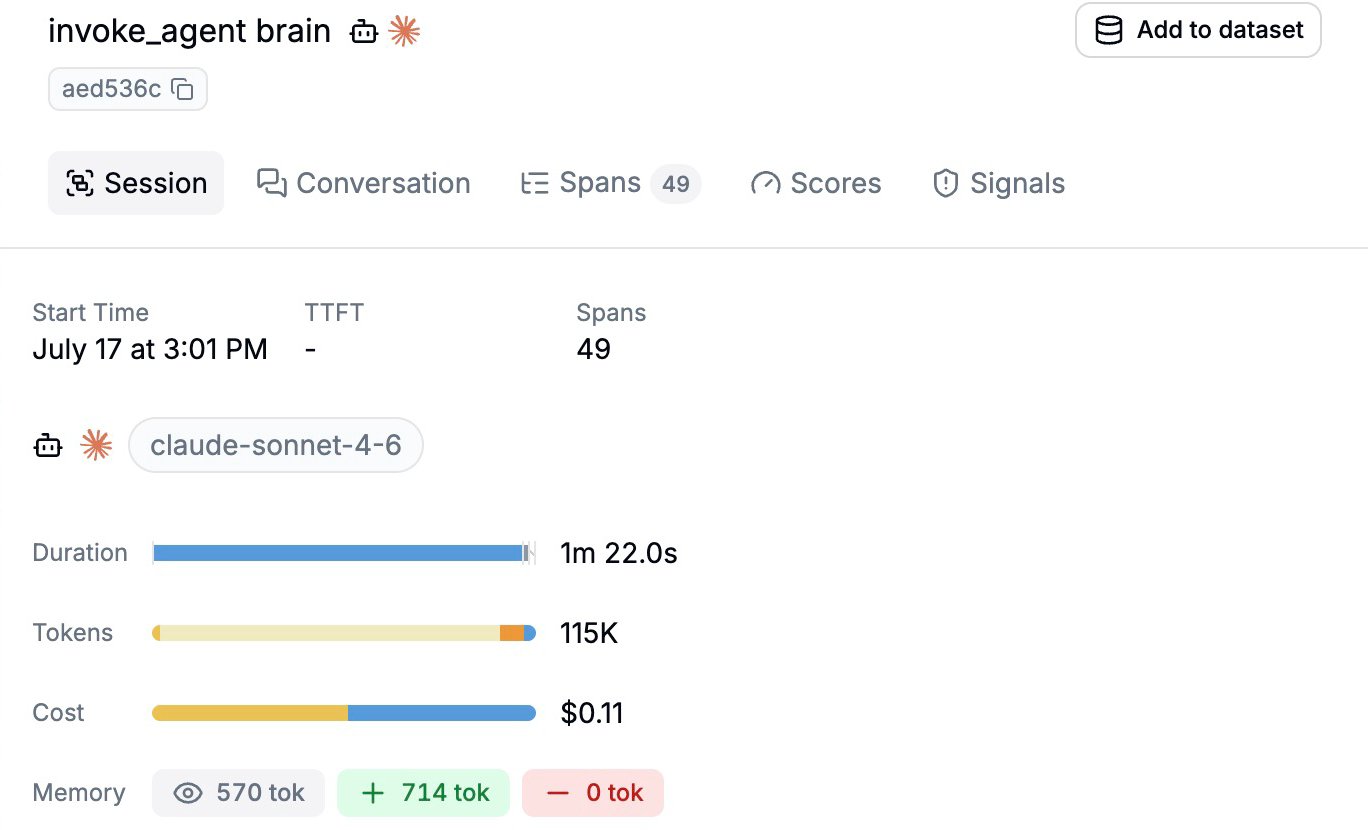
Memory spans on the Spans tab
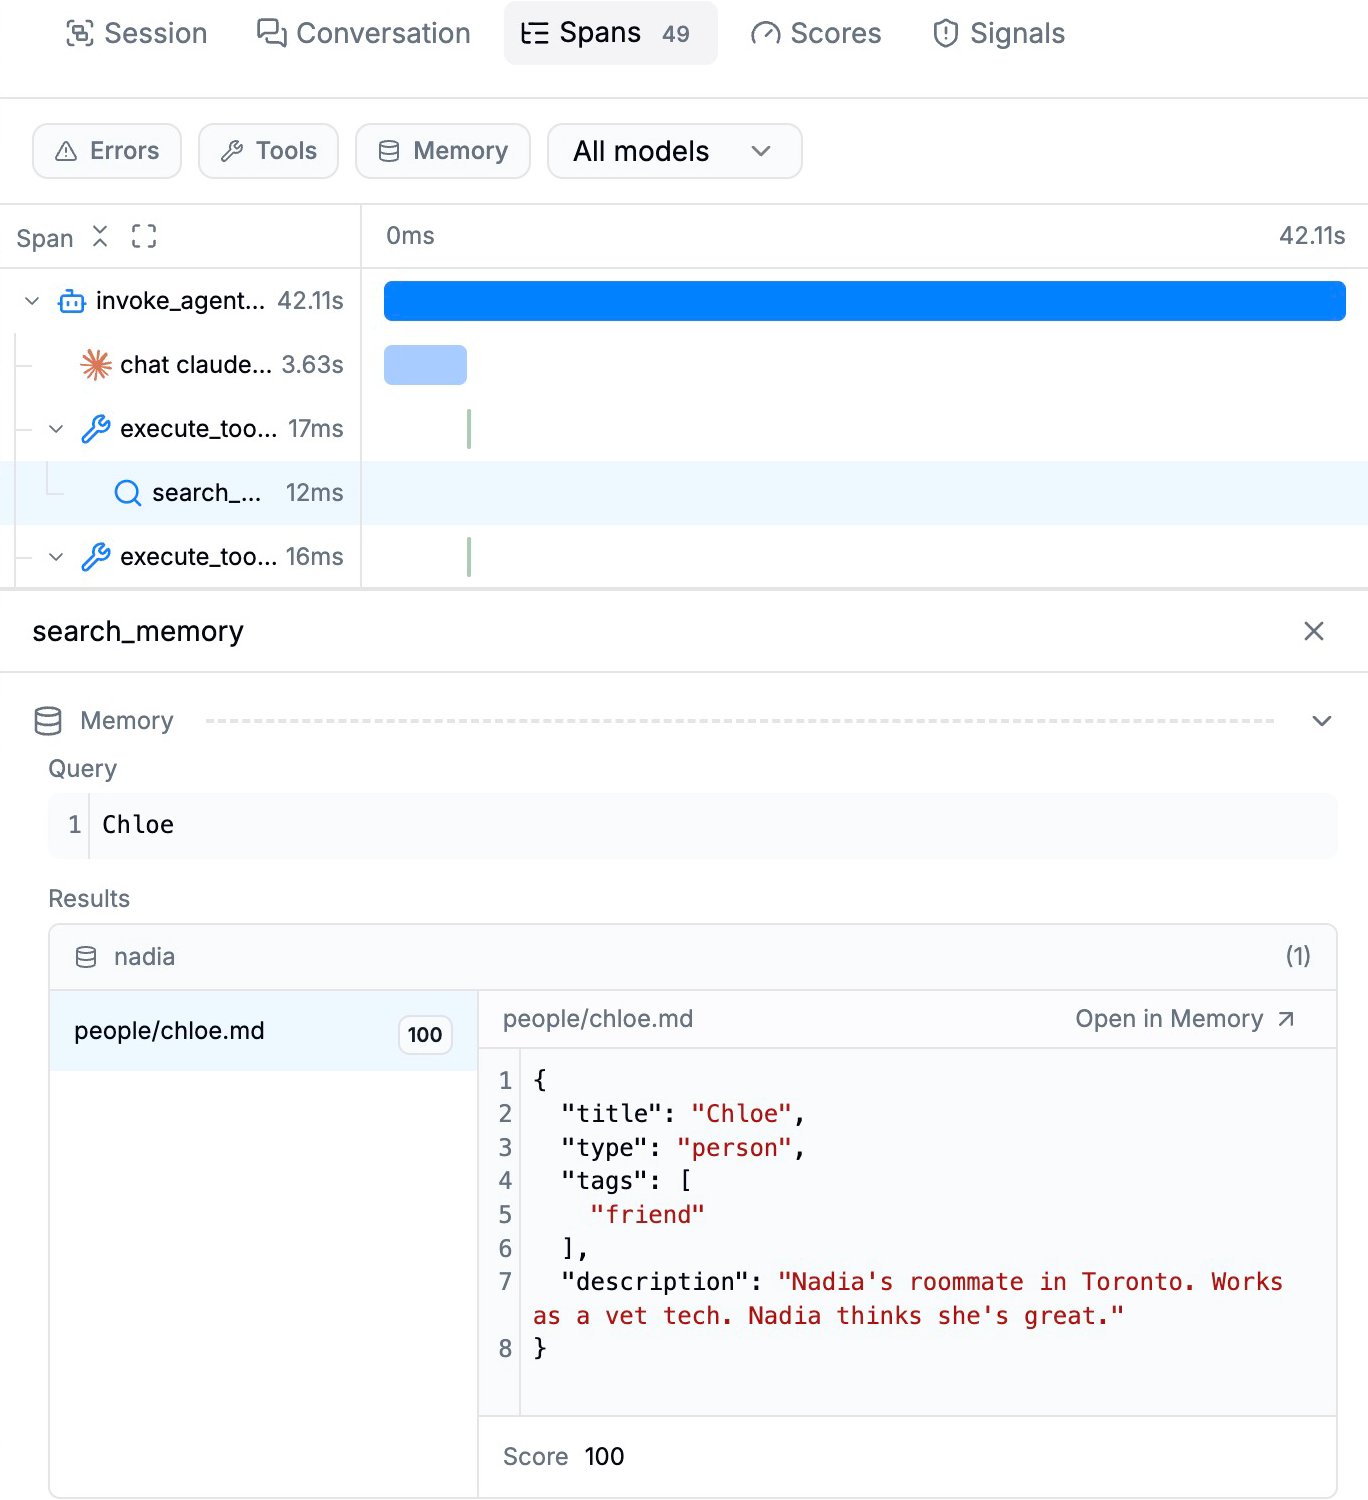
Memory operations are first-class spans. They get their own color in the trace waterfall, a Memory filter on the Spans tab, and a detail panel showing the operation’s store, query, and records. Search results include each record’s relevance score. When content capture is off, the panel shows record ids and counts with aContent not captured note in place of the bodies.
Memory on user pages
Each end user’s page includes a Memory stores section listing the stores that user read or wrote, with the last access time, each linking into the Memory page. It answers “whose sessions have been writing to this store” from either direction.Memory over the API and MCP
Your own tools and coding agents can read memory over the REST API, the MCP server, the SDKs, and the CLI: list stores, read a store’s snapshot, read a record with its change history, fetch a change’s diff, list a record’s reads and users, and read a session’s or trace’s memory footprint. The analytics on this page, the statistics panel and the store dashboard, are not part of that surface. See the API reference.Related
- Memory tracing: Instrument your agent to emit memory operations
- Spans: The span model memory operations ride on
- Sessions: The sessions memory changes link back to
- Users: Per-user activity, including memory stores accessed