Monitors
A monitor watches your production traffic and opens an incident when a condition you care about is met. Each monitor has one alert, which watches a single signal or saved search with its own condition and severity. When the alert fires, Latitude records an incident and sends you a notification through your existing notification channels. Monitors live on the Monitors page of each project. Open it from the project sidebar.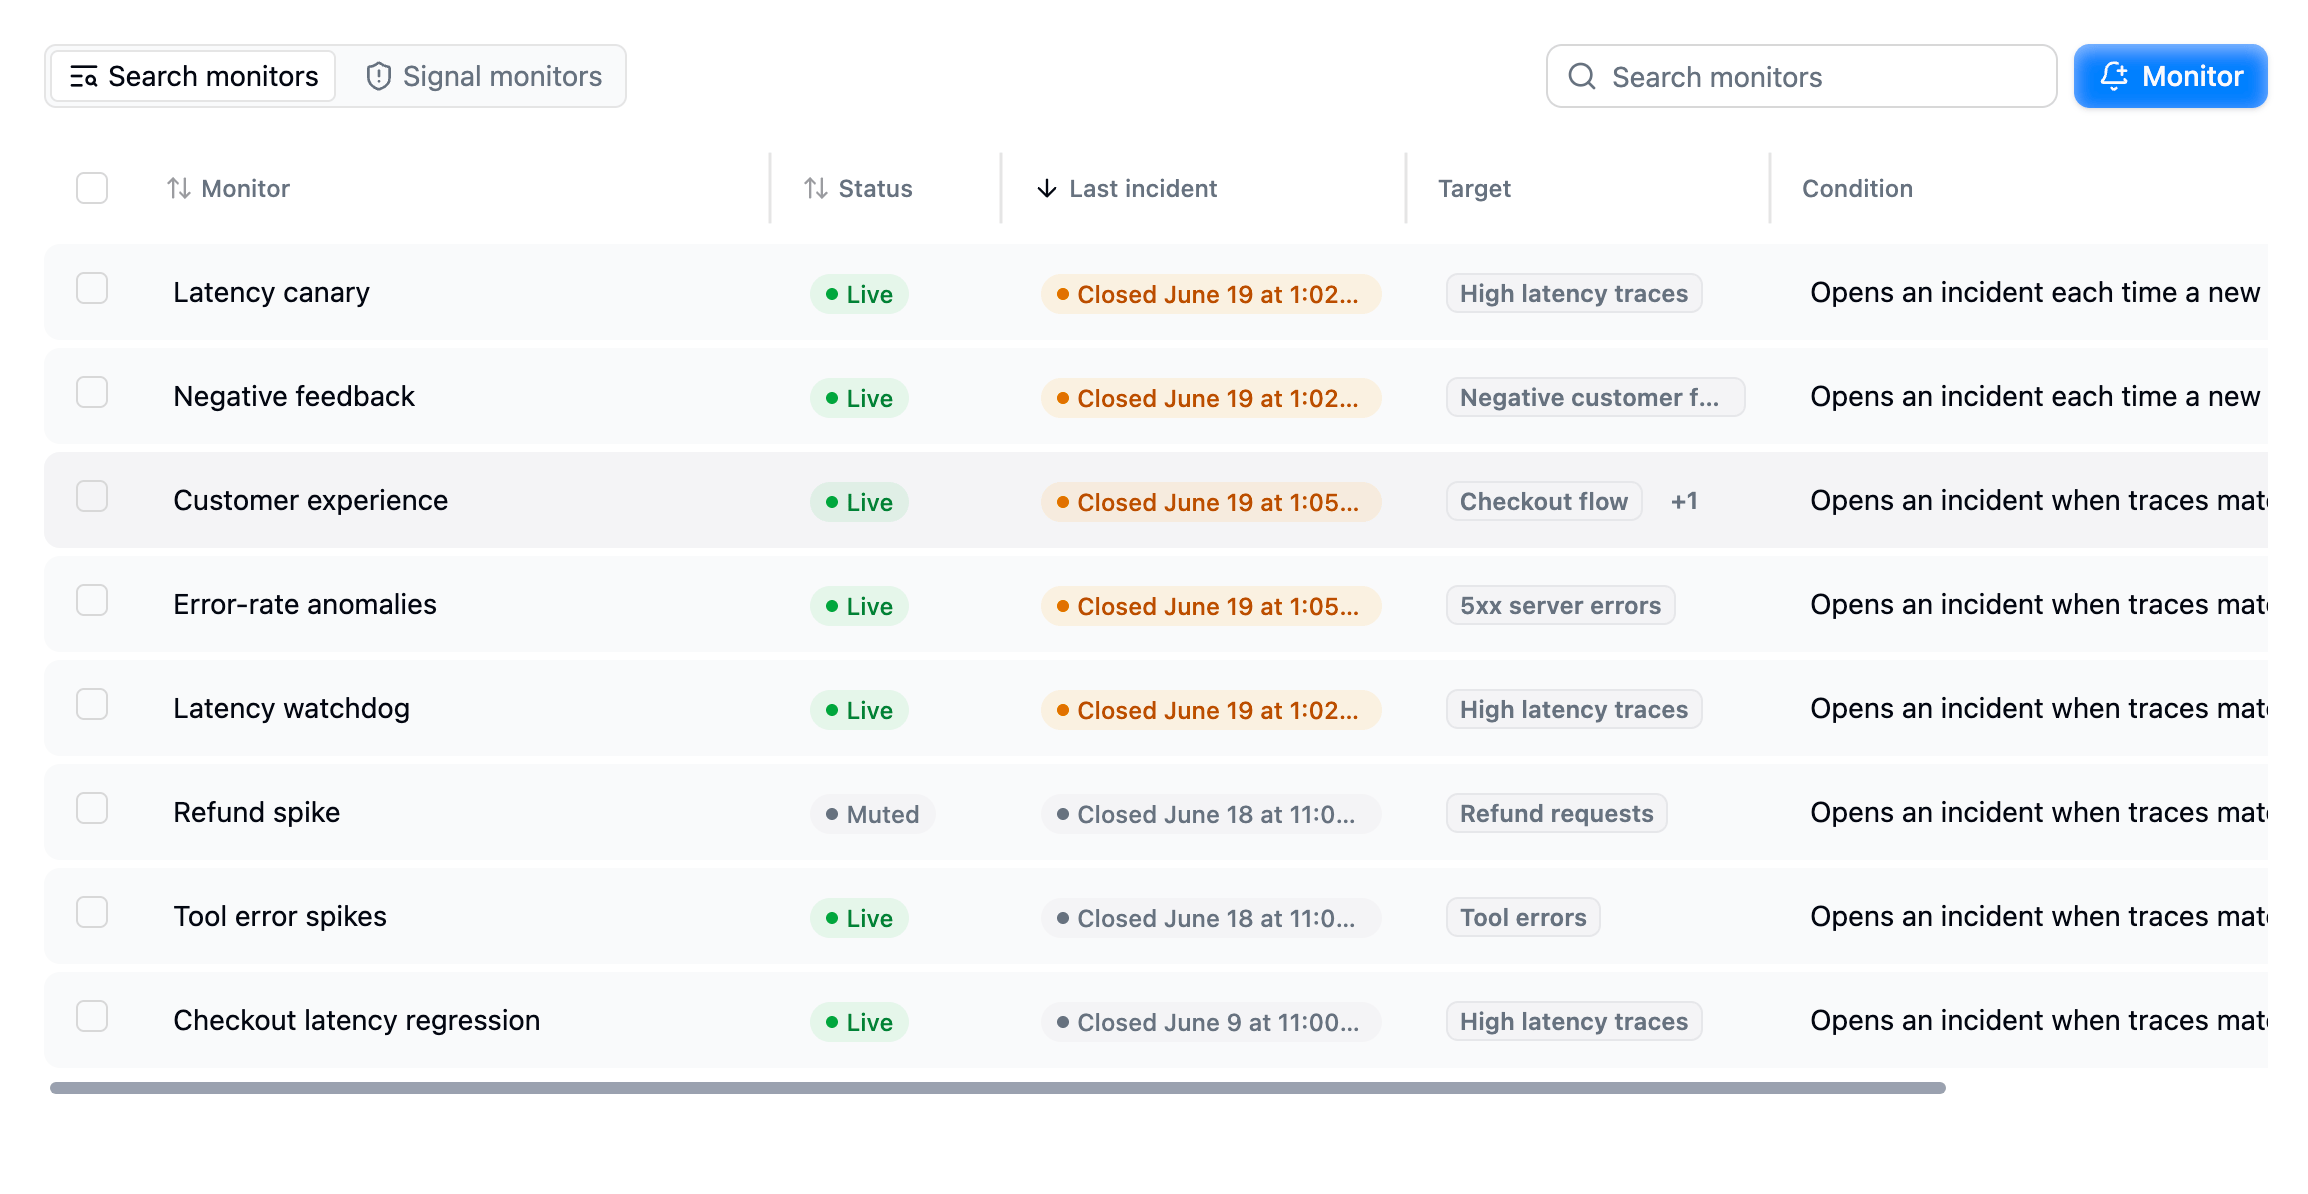
The Monitors page: system and user monitors side by side, each with its status, last incident, and a plain-English summary of its condition.
System monitors vs. your monitors
There are two kinds of monitors:- System monitors are set up automatically for every project. They watch your signals and are marked with a System badge. You can’t create, rename, or delete them, and you can’t change what they watch, but you can mute them.
- Your monitors are the ones you create. Today they watch saved searches. You have full control: edit the alert, rename, mute, and delete.
System monitors have a System badge next to their name.
The three system monitors
Every project comes with three monitors that watch the signal lifecycle. Each one notifies you about a different moment:- Signal discovered: fires each time a brand-new signal is detected in your traffic.
- Signal regressed: fires when a signal that had gone quiet starts being detected again, so a problem you thought was behind you doesn’t slip back unnoticed.
- Signal escalating: fires when an ongoing signal is being detected more than expected for this time of day and week. This is the one monitor with a tunable knob: its sensitivity (a value from 1 to 6) controls how large a deviation from the normal pattern is needed before it fires. Open the monitor and edit the alert to change it.
Creating a monitor for a saved search
You create your own monitors on top of saved searches. A saved search defines which traces you care about; the monitor decides when that pattern is worth an alert. There are two ways into the create flow:- From the Monitors page: click the Monitor button in the top-right and pick a saved search inside the form.
- From a saved search: open the Saved searches dropdown next to the search bar on the Traces page. Hover a saved search and click its bell icon for Create monitor (or View monitor if one already watches it), which opens the same form with that search pre-selected.
"literal" or backtick `phrase` terms — those match exactly, and the monitor counts every match.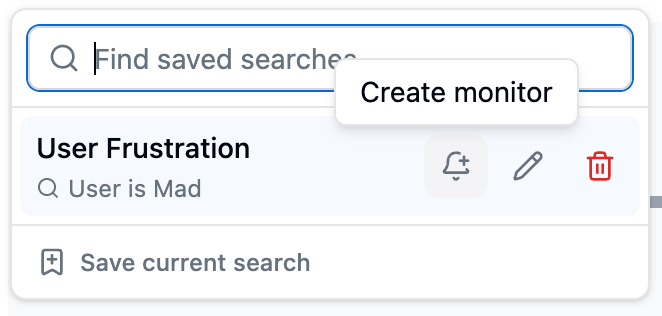
The Saved searches dropdown: hover a saved search and click the bell icon to create a monitor that watches it.
- Name: a human-readable label, e.g. “Tool error spikes”.
- Description: optional; what the monitor is for.
- An alert: a card where you pick the saved search, the alert kind, the condition, and a severity.
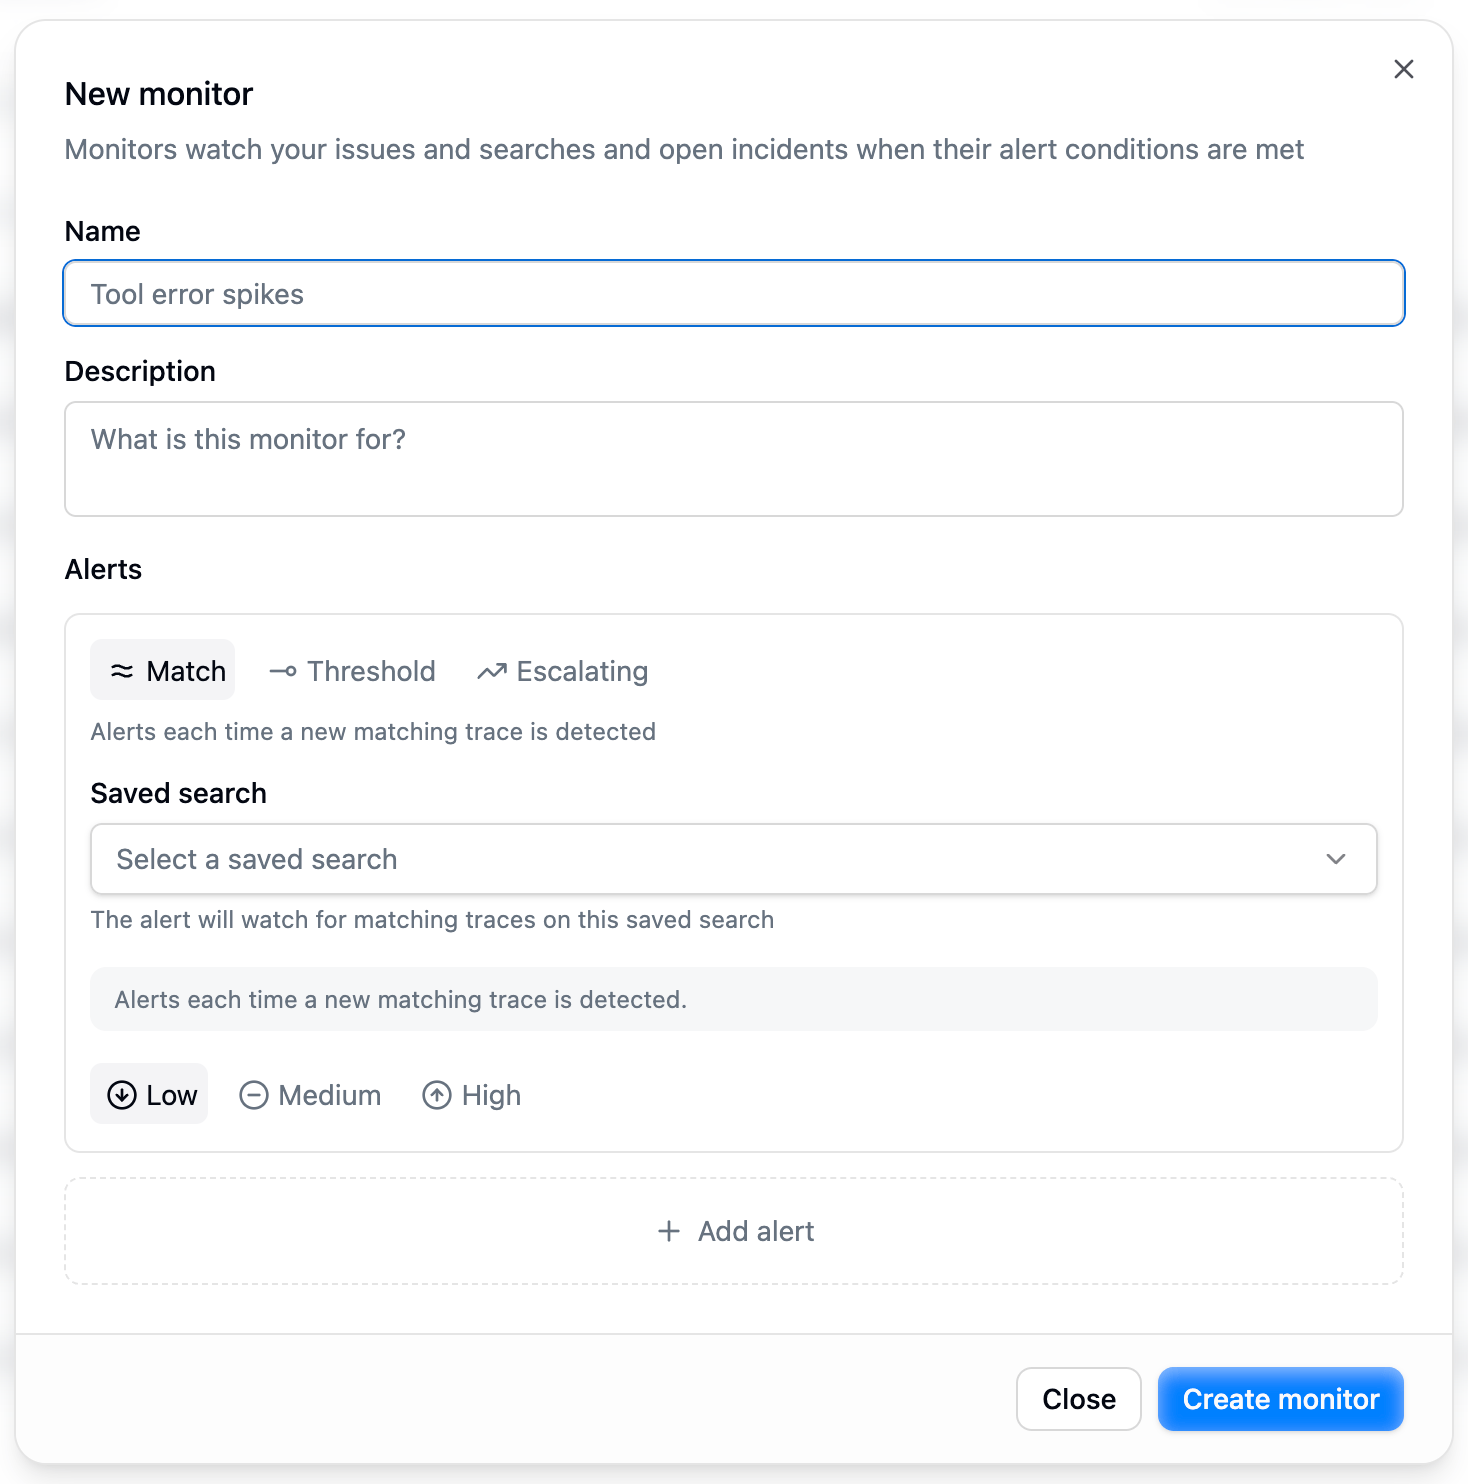
Create a monitor form: a name, an optional description, and the alert card. The preview sentence at the bottom of the card restates the configuration in plain English.
The three saved-search alert kinds
A saved-search alert can watch its search in one of three ways, shown as tabs on the alert card: Match, Threshold, and Escalating.Match: alert when matching traces start arriving
Use Match when even one matching trace is worth knowing about, for example a saved search forstatus = 5xx in production.
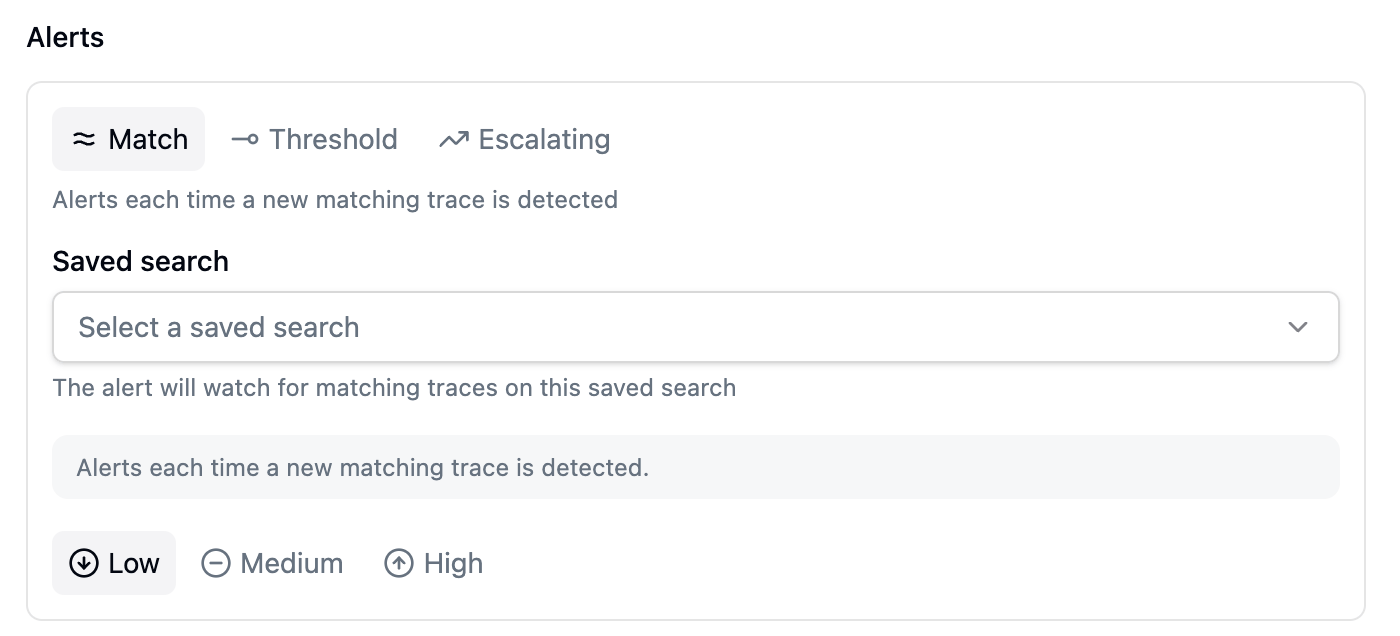
A Match alert card: pick the saved search to watch and a severity. It fires each time a new matching trace is detected.
- A burst of 500 matches arriving at once produces one alert, not 500.
- If matching activity is continuous, you’ll get a fresh alert every 5 minutes for as long as it keeps happening, so an ongoing problem stays visible instead of going quiet after the first alert.
- After a quiet period with no matches, the next match opens a fresh alert again.
Threshold: alert at a milestone or a spike
Use Threshold when one match doesn’t matter, but a lot of them do. The threshold row reads as a sentence you complete: Alert when traces are detected … [amount] [comparison] [baseline]. There are three flavors.Absolute count
A simple count: alert once you’ve seen a set number of matching traces.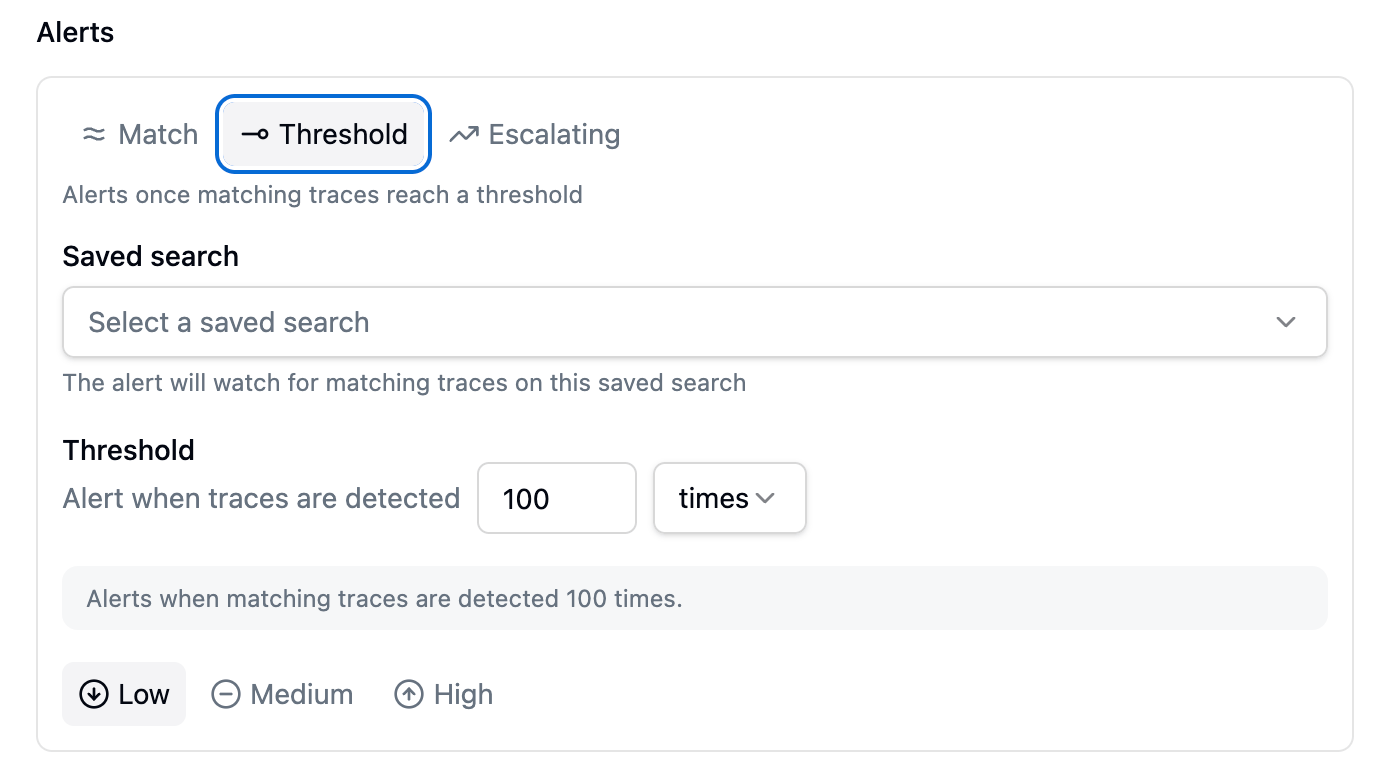
A Threshold alert card in absolute-count mode: the threshold row reads 'Alert when traces are detected 100 times'.
Multiplier: relative to a baseline
Spike detection: alert when the current volume rises to some multiple above a baseline you choose. Pick the comparison times more than and then choose the baseline:- The average of the last N hours/days: the normal-traffic case. Latitude divides the baseline window into 5-minute slices and compares your current rate against the average slice.
- The previous period (yesterday, or the previous week): for traffic that follows daily or weekly patterns, where “normal” depends on the day or time.
Expected: a baseline that learns your patterns
The smartest option: alert when you’re seeing more traffic than expected for this time of day and week. Unlike average or previous-period, you don’t pick a comparison window at all: Latitude learns what’s normal for each time of day and day of the week on its own.Escalating: alert only when a spike sticks around
Use Escalating when you want to ignore short blips that fix themselves, and only hear about a problem that sticks around. An escalating alert combines any of the threshold modes above with a window: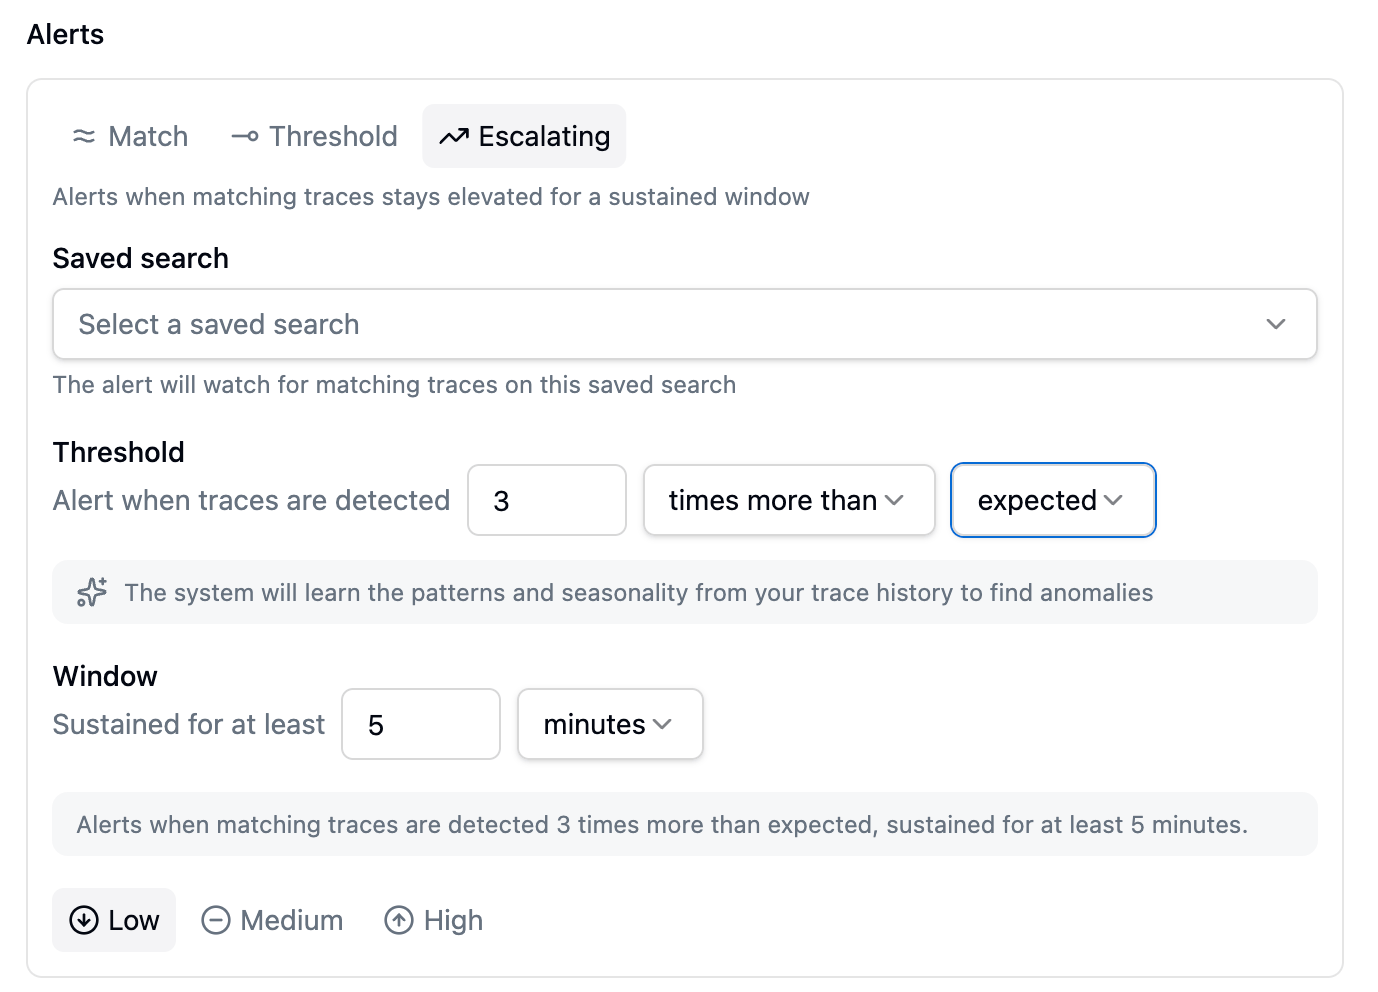
An Escalating alert in expected mode: 'detected 3 times more than expected', plus a Window that requires the condition to be sustained for at least 5 minutes.
- It’s the measurement window: the condition has to stay true for the whole window, not just for a moment. A single one-minute spike won’t trip it.
- It’s the cool-down: once an incident opens, it stays open until things have been calm for that same window, so it doesn’t rapidly open and close.
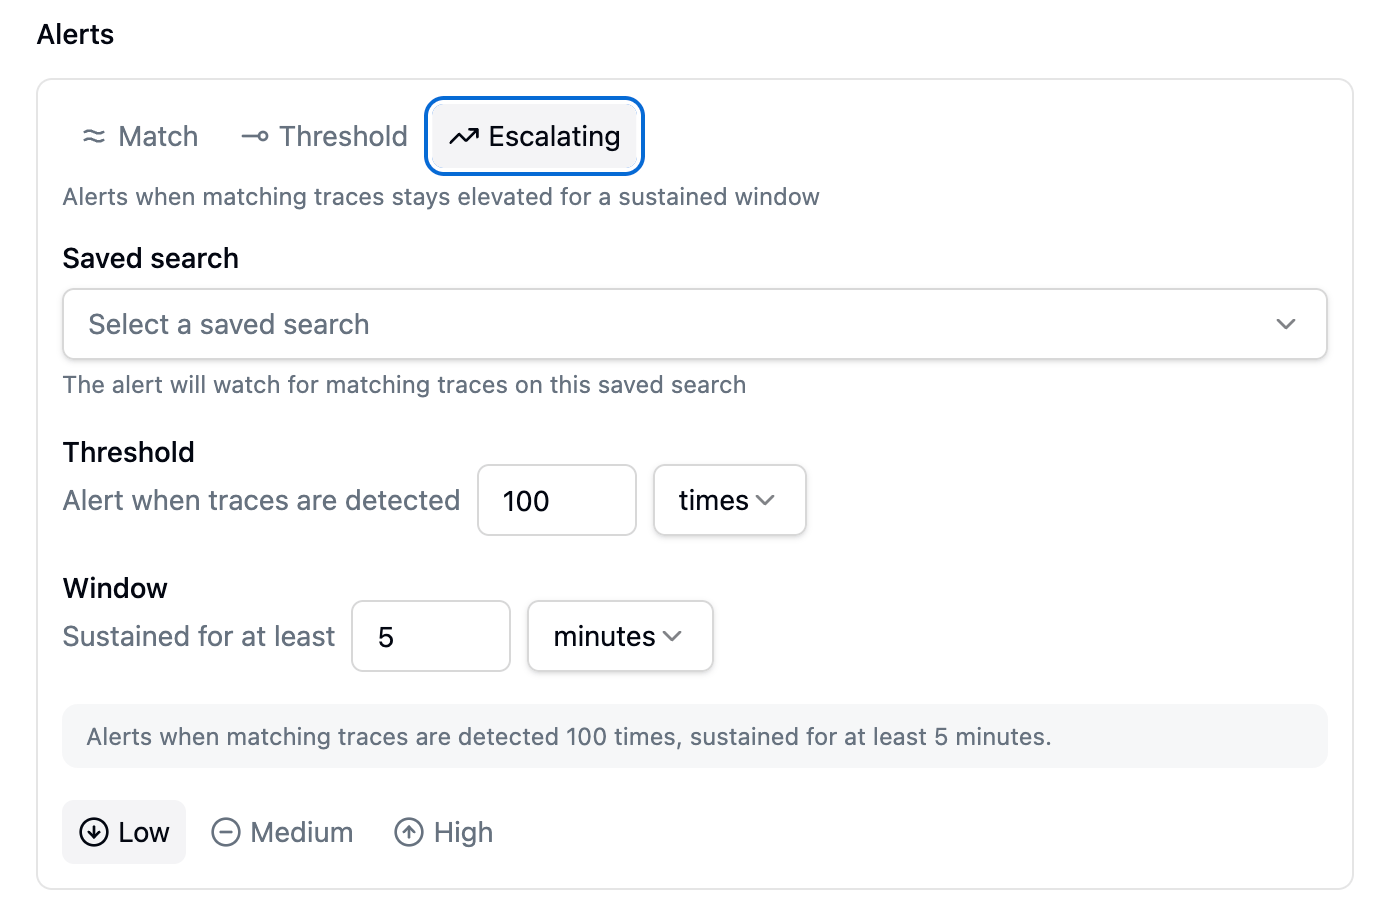
The same Escalating kind wrapping a plain absolute count: 'detected 100 times, sustained for at least 5 minutes'.
Mute, delete, and edit
Mute
Muting a monitor stops it from notifying you, but it keeps recording incidents. Open the monitor and use the Mute / Unmute button, or use the actions menu on the list row. Muting is the right tool for a monitor that’s correct but currently noisy: you keep the incident history for later, you just stop the notifications. A muted monitor shows the Muted status in the list; a live one shows Live.Delete
You can delete your own monitors from the list’s actions menu. A few rules:- System monitors can’t be deleted: mute them instead.
- A monitor keeps its alert for life — the alert can’t be removed on its own; it’s edited in place or deleted along with the monitor.
- Deleting a monitor stops it firing and hides it from the list. Incidents it already recorded remain queryable.
Edit
What’s editable depends on the monitor type:How notifications work
When a monitor fires, the incident goes through Latitude’s normal notification system, the same one used everywhere else. Monitors themselves don’t carry notification settings:- Who gets notified and on which channel is controlled by your per-user and per-project notification preferences, not by the monitor.
- A monitor’s only effect on delivery is its mute state: a muted monitor still records incidents but stops the notifications from going out.
Next steps
- Signals overview: what the system monitors watch
- Saved searches: the basis for your own monitors
- Search overview: building the queries your monitors watch