Latitude Overview
Latitude is an open-source, MIT-licensed platform for improving production AI agents. It helps teams capture real agent traffic, understand what is going wrong, and turn repeated failures into tracked signals you can monitor and fix. The product is organized around the loop you work in every day: Observe, Understand, Refine.Observe
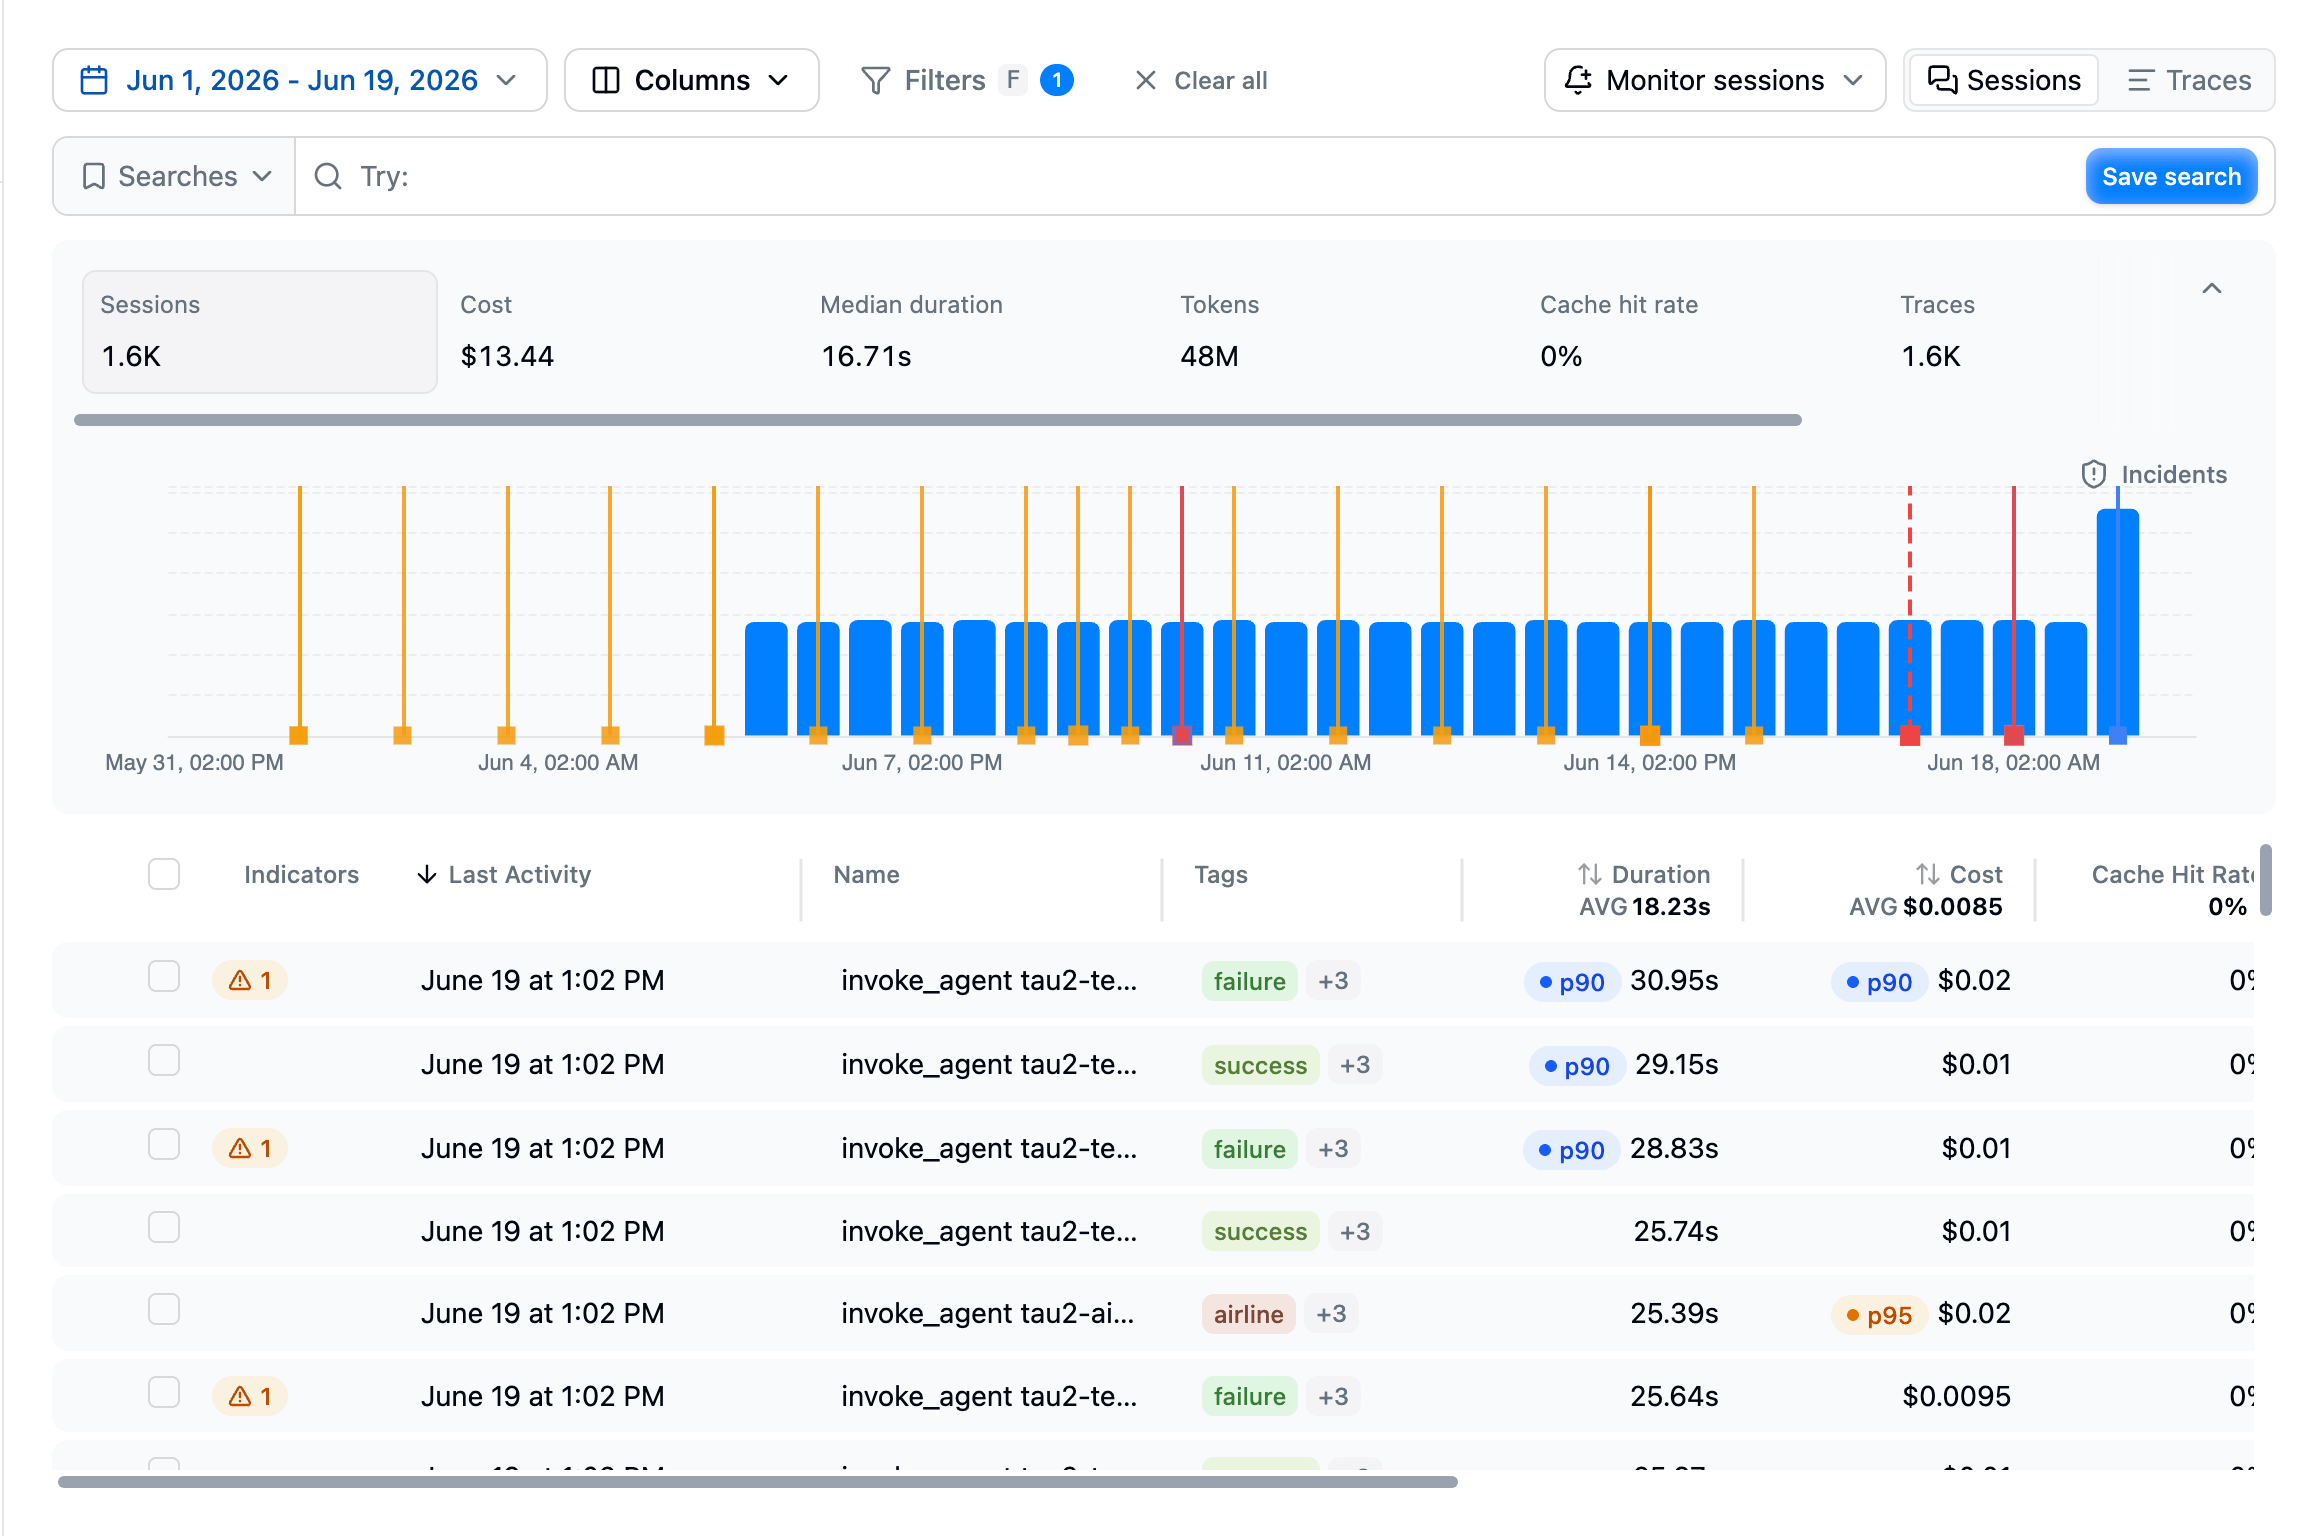
Latitude starts by collecting agent telemetry. Each interaction becomes a trace made of spans for LLM calls, tool calls, retrieval steps, and other instrumented work. Related traces are grouped into sessions so you can review full multi-turn conversations. Observe lets you inspect:- traces, spans, and sessions
- model providers, models, tokens, latency, cost, and errors
- tool calls and nested execution paths
- per-user activity in the Users view, and per-tool reliability, errors, and latency in the Tools view
- tags, metadata, environments, and releases
Understand
Once traffic is flowing, Understand helps you find what matters and group it into something you can track.- Search finds behaviours across production traces by meaning, exact text, or metadata filters, so you can move from a broad question to a focused set of real examples.
- Behaviours clusters your sessions by meaning into the topics users actually hit, with trends and outcome metrics, so you discover what matters without writing a query.
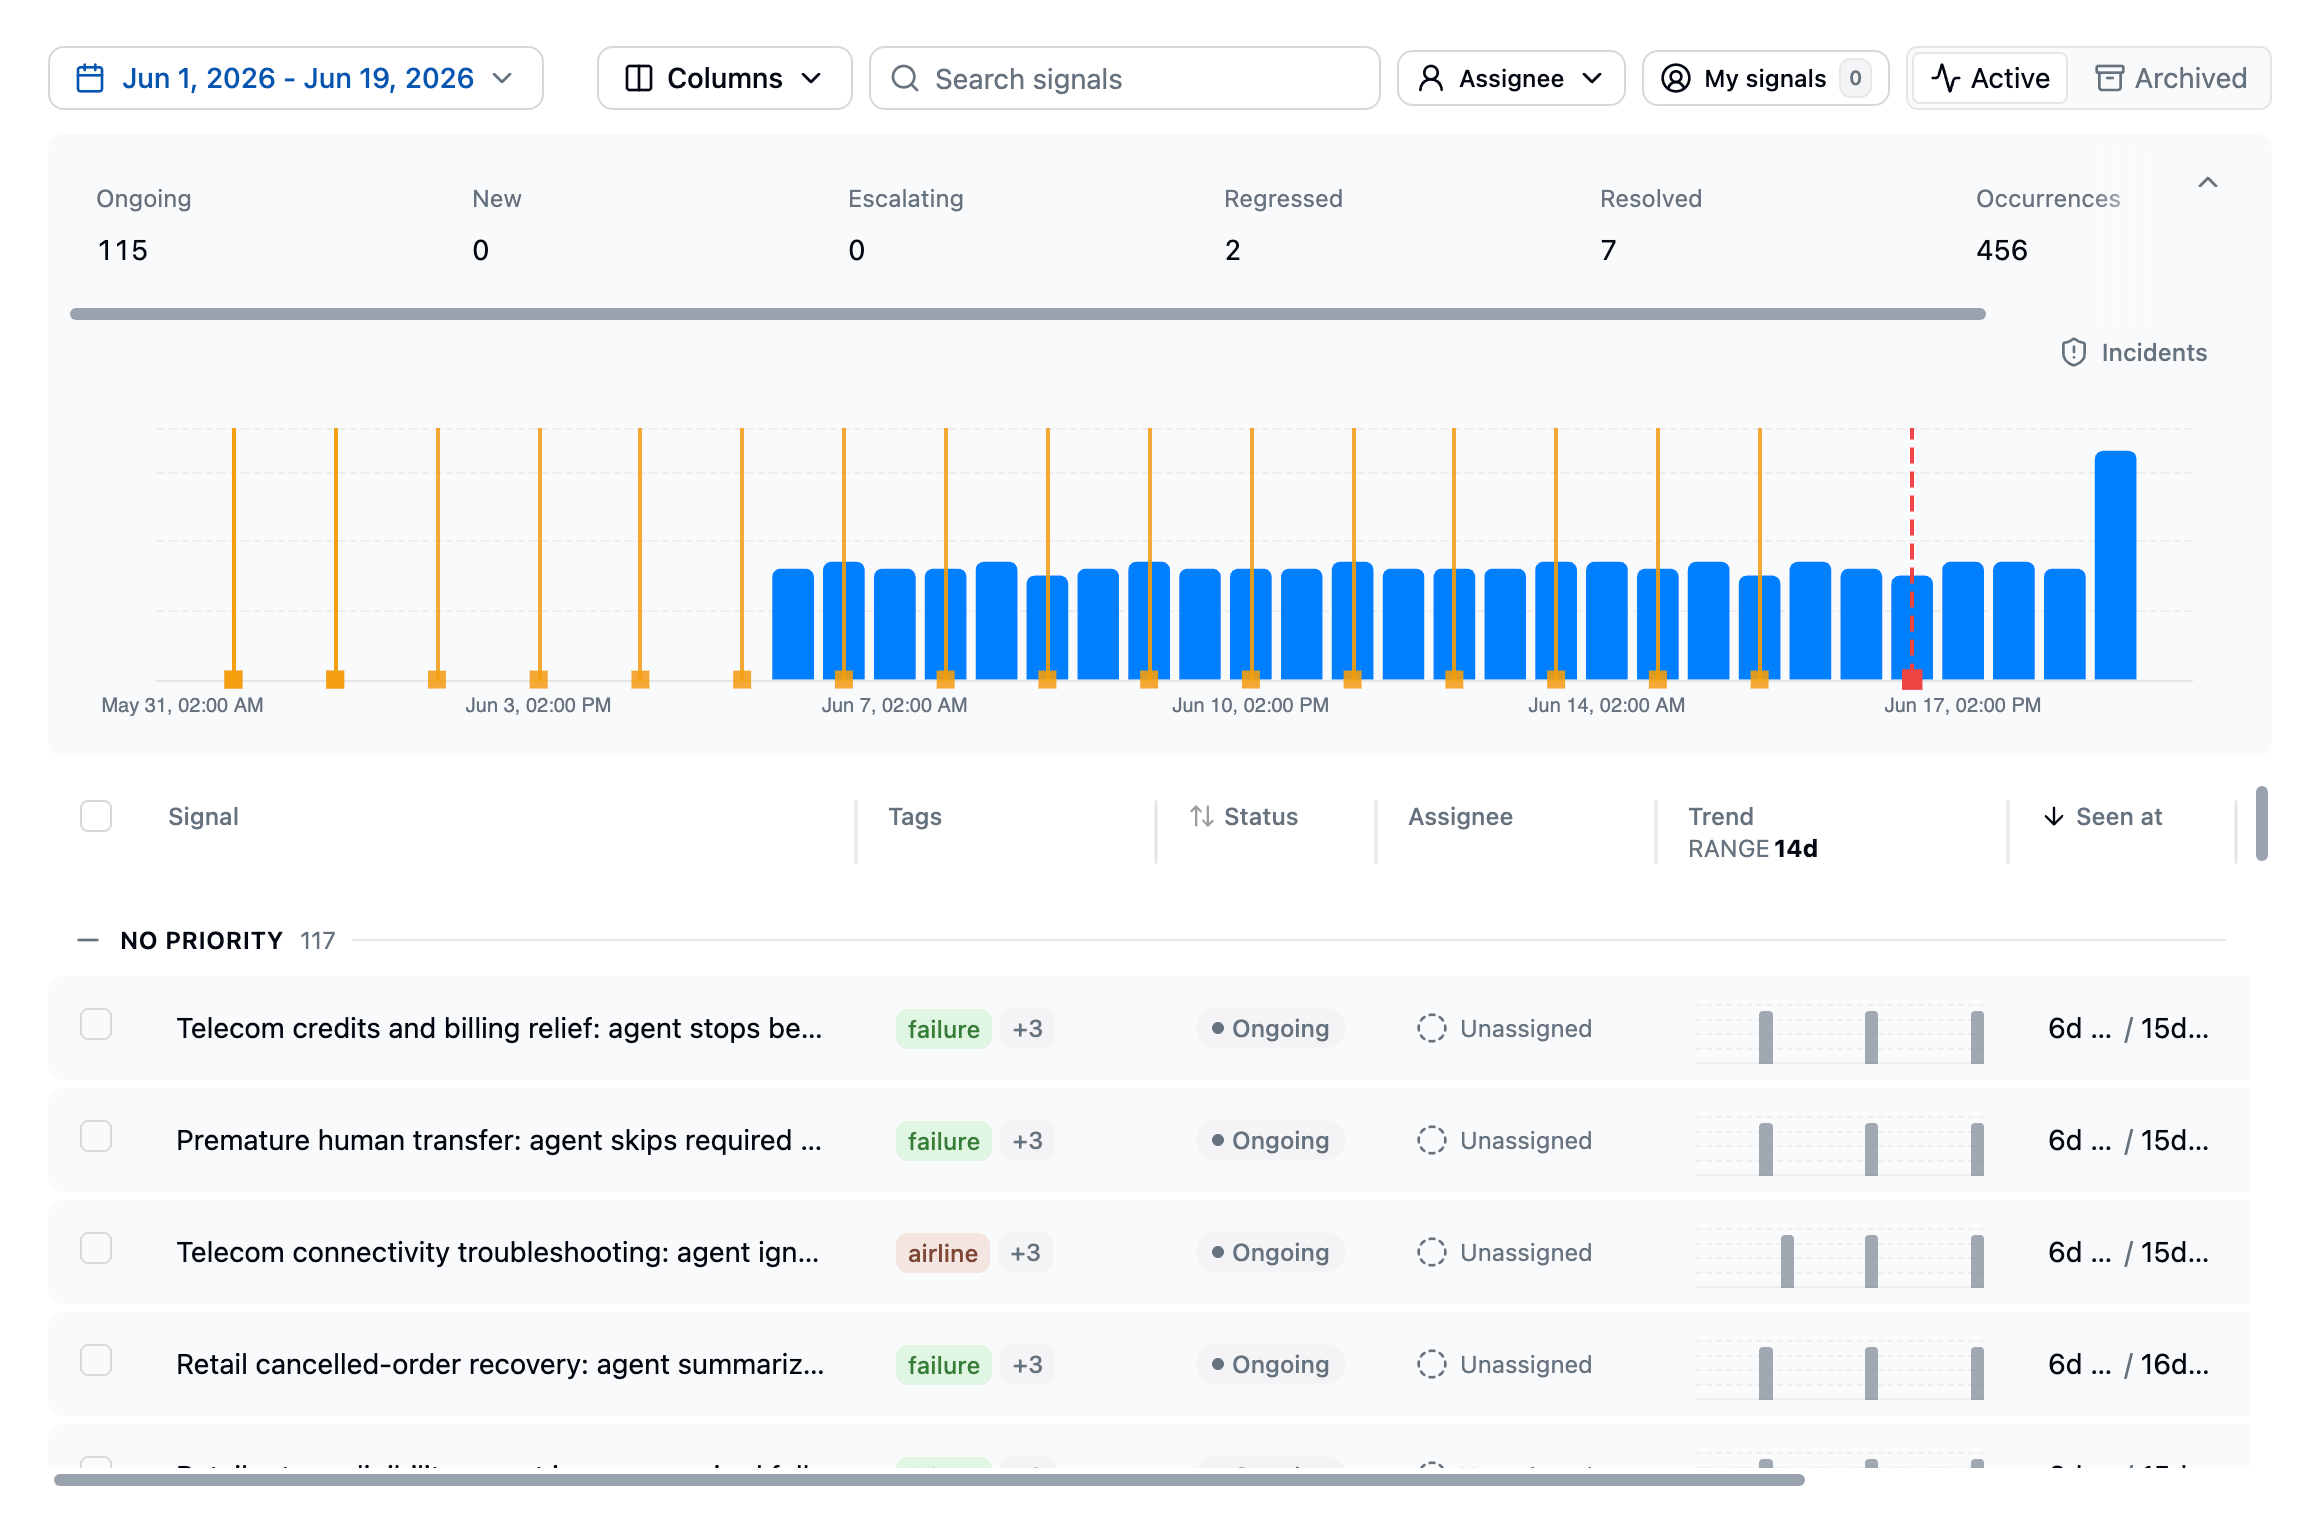
- Signals are the recurring failure patterns Latitude groups from failed scores. Human annotations, flaggers, evaluations, and custom checks all feed in, and each signal carries example traces, affected-user counts, trends, and a lifecycle your team can act on.
Refine
Refine turns what you learned into guardrails. Monitors watch a signal, a saved search, or your raw traffic and open an incident when something needs attention, notifying you in-app, by email, or in Slack. Evaluations generated from a signal keep scoring live traffic, so you catch regressions after you ship a fix.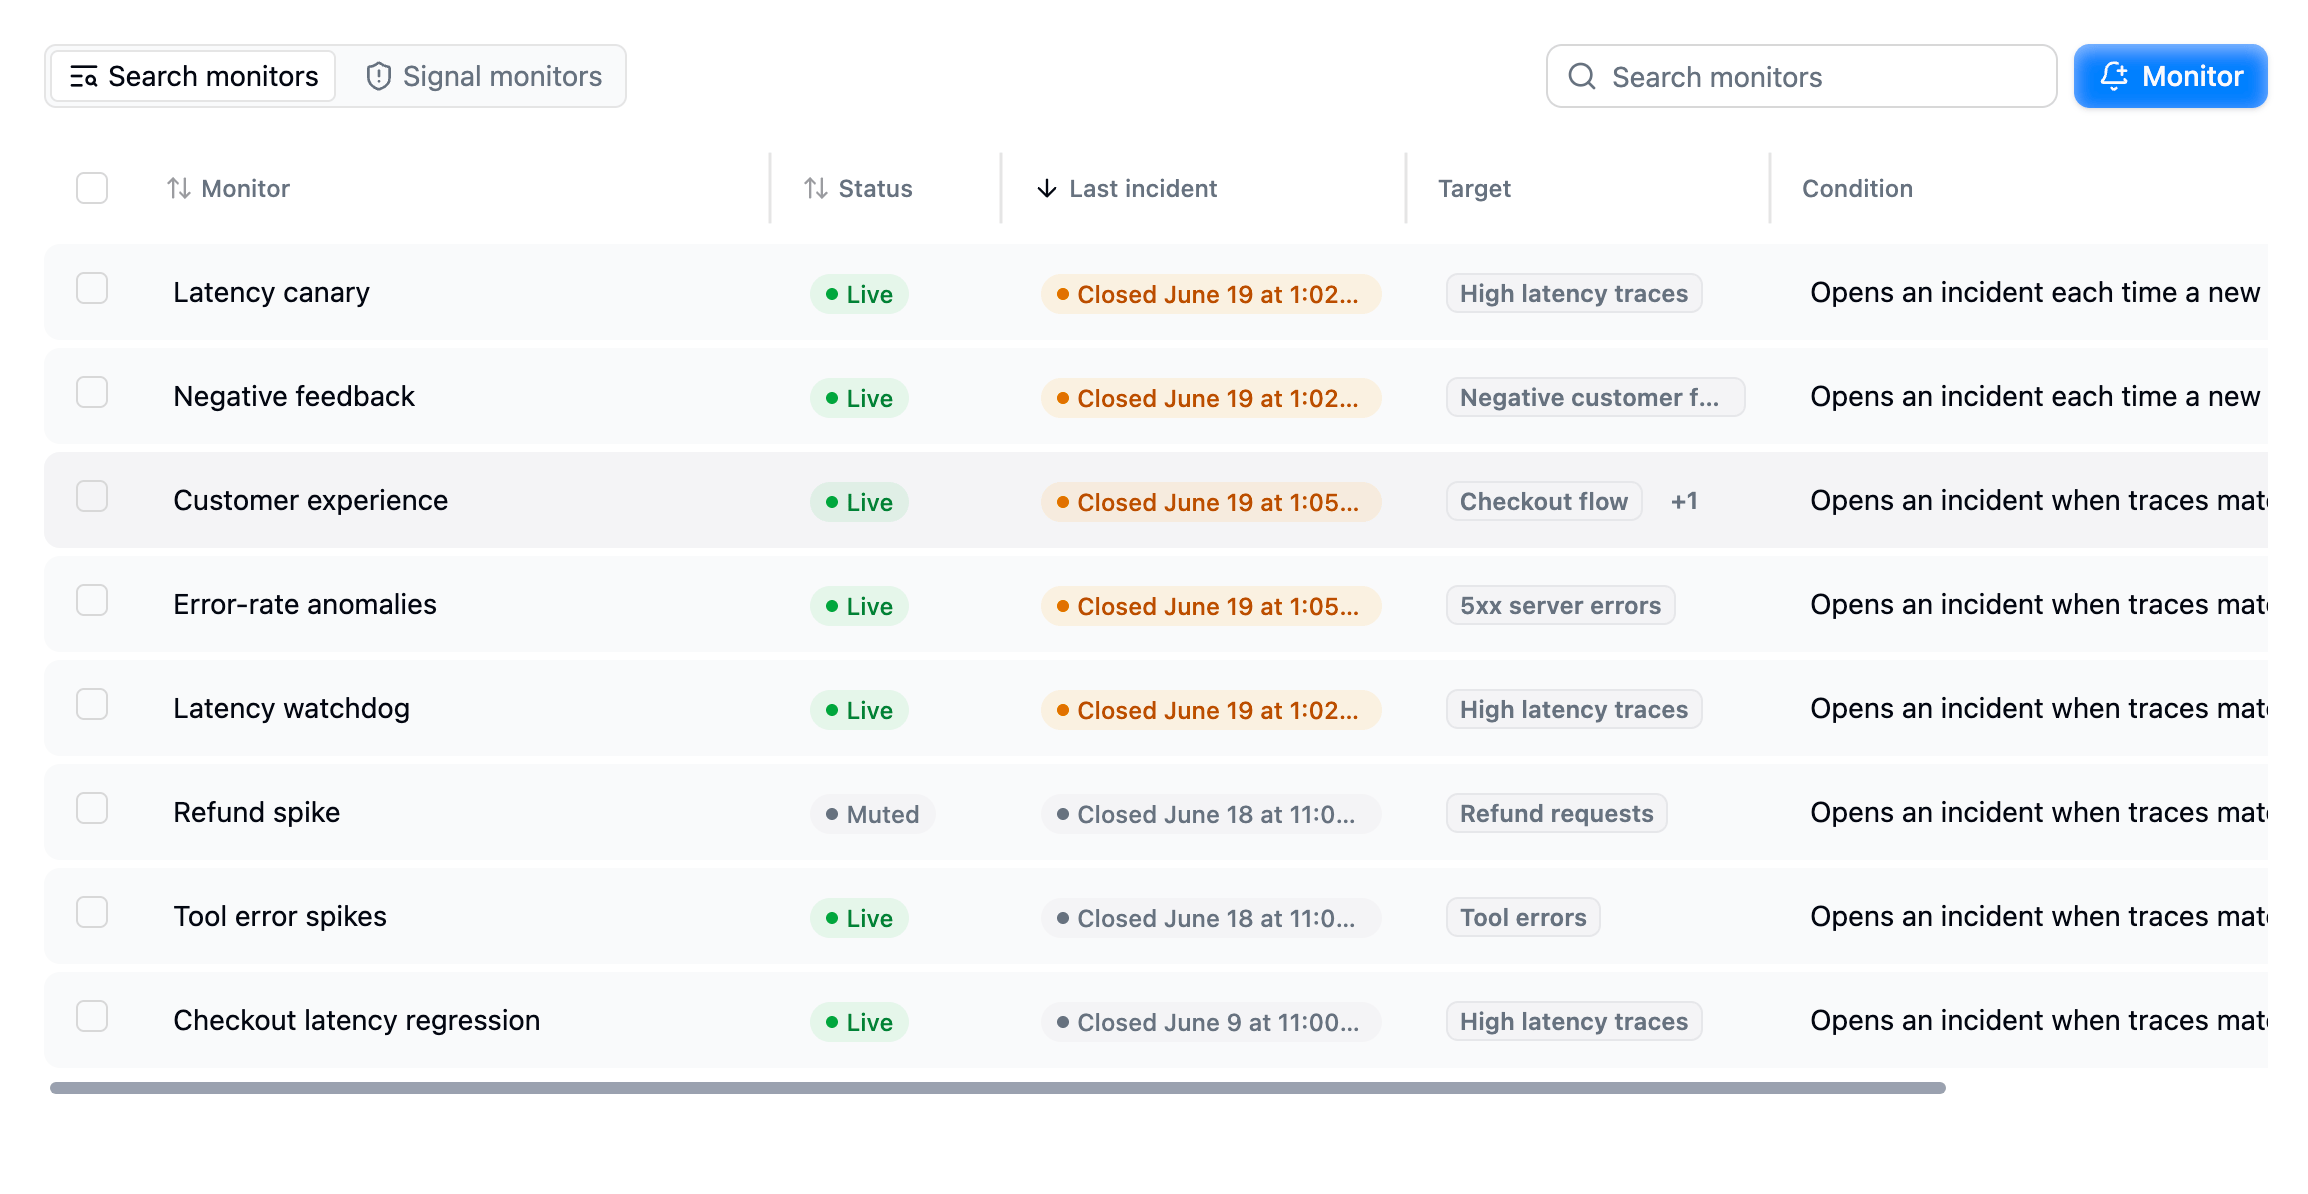
Why Latitude?
AI agents fail in ways that are hard to predict upfront. Logs and dashboards show individual events, but teams also need to understand repeated behavioural failures: what users experienced, how often it happened, who was affected, and whether a fix prevented it from coming back. Latitude is built around that loop:- Agent-native telemetry: inspect multi-step agent behaviour, not just isolated API calls.
- Semantic discovery: search by meaning, and let Behaviours surface patterns you did not know to look for.
- Signal-centric workflow: turn failures into named, trackable problems instead of scattered examples.
- Human-aligned monitoring: annotations, evaluations, and scores work together so automated monitoring stays connected to human judgment.
- Open source and MIT licensed: run, inspect, self-host, fork, and contribute to the platform your team depends on.
How Latitude is different
Most LLM observability platforms focus on one narrow part of the production quality loop. Tools such as Langfuse, Datadog, Sentry, and PostHog are useful for visibility, evaluation, analytics, or feedback workflows, but they usually leave the work of turning scattered findings into trackable AI-agent signals to the team using them. Latitude is built around LLM signal discovery. Observability, semantic search, behaviours, annotations, flaggers, scores, and evaluations are designed to work together automatically so teams can track production agent failures with minimal manual setup. It is also open source, where most tools in this space are closed, proprietary SaaS. Latitude is MIT licensed and self-hostable, so you can run it in your own infrastructure, audit exactly how your data is handled, and adapt it to your needs. See Open source below. The difference is the combined workflow:- Flaggers detect common failure categories automatically, such as frustration, refusal, jailbreaking, tool errors, and empty responses.
- Search and Behaviours help teams find product-specific failure modes across real conversations.
- Annotations turn human review into structured input that can create or refine signals.
- Automatically human-aligned evaluations convert important signal patterns into monitors that stay connected to human judgment.
- Signals bring those findings together into named, prioritized, lifecycle-managed production failure patterns.
Open source
Latitude is fully open source under the MIT license. The entire platform lives on GitHub, so you can read the code, audit how your data is handled, fork it, and contribute. You can run it two ways:- Self-hosted: host Latitude yourself for free, from a single host to a full cluster. Your data stays in your own infrastructure.
- Latitude Cloud: the managed version, so you do not have to operate it.
Getting started
- Start tracing: connect your agent and send your first traces to Latitude.
- How to use Latitude: follow the recommended workflow for finding, tracking, and fixing production signals.