Where this fits: Behaviours are part of the Understand section. Search finds what you
already know to look for; behaviours surface what you didn’t.

What you see
Behaviours are organized as a hierarchy of topics and subtopics that emerge from your data. For each behaviour, the page shows:- a trend: for example new, spiking, rising, steady, cooling, or fading
- the number of sessions in that behaviour
- outcome metrics such as escalation rate, resolution rate, churn risk, and wins
Live behaviours appear after Latitude has clustered enough sessions. Until then, the page guides
you to send more traffic.
Inspect a behaviour
Open any behaviour to see representative example sessions and how the topic has evolved over time. From there you can review the underlying traces, annotate them, and let recurring failures flow into Signals.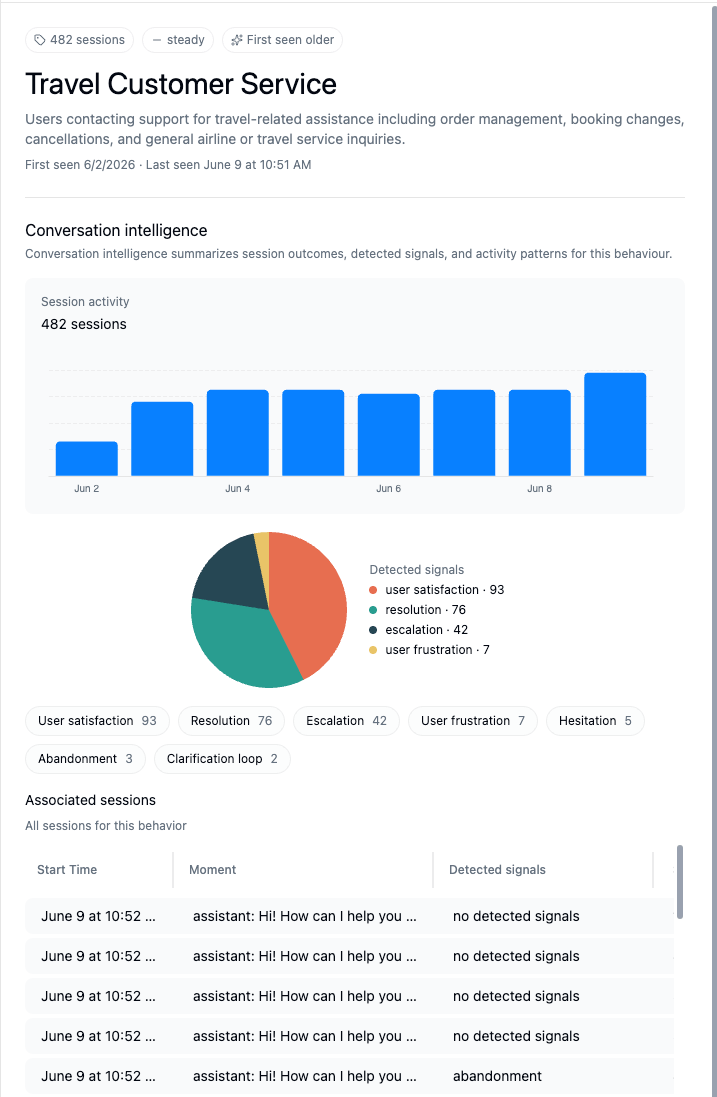
Filter searches by topic
The same topics are available as a Topics filter in Search, so you can narrow any search to a specific behaviour and combine it with semantic, text, and metadata filters.Next step
- Saved searches: bookmark a behaviour or query and review it over time.
- Signals: turn recurring failures in a behaviour into a tracked signal.