

Signal discovery
Signals are recurring behavior patterns in your agent’s production traffic, usually failures. Latitude discovers most of them for you by grouping similar failed scores, and gives each signal a name, examples, trends, and a lifecycle your team can act on. The loop is the same whether a signal is discovered or defined: find the behavior, explain it, monitor it, fix it, and watch for it coming back.Most signals are discovered for you. You can also create one yourself when you already know the behavior to track: a specific failure, a policy to enforce, or a check you want from day one.
How signal discovery works
1. Traces capture real behavior
Your telemetry sends real user and agent interactions into Latitude as traces. These traces are the raw material for signal discovery.2. Signals produce scores
Latitude uses several signal sources to decide whether a trace represents good or bad behavior:- Annotations: Human feedback left on traces during review.
- Flaggers: Built-in automatic annotators for categories such as frustration, refusal, jailbreaking, incompletion, bluffing, PII leakage, tool call errors, and empty responses.
- Evaluations: Automated monitors that track signal patterns across incoming traces.
- Custom scores: Domain-specific verdicts you submit from your own systems.
3. Failed scores become signal candidates
When a score fails, Latitude compares its feedback and trace context against existing signals.- If it matches an existing signal, the score becomes a new occurrence of that signal.
- If it does not match, Latitude creates a new signal candidate.
4. Candidates are promoted once they have evidence
A discovered candidate stays invisible until the same pattern has appeared in enough distinct sessions, so one-off failures never clutter your Signals page. The threshold scales with your project’s traffic: at least 2 sessions in a quiet project, up to 15 in a high-volume one, counted over the last 30 days. At promotion Latitude generates the signal’s real name and description from its recent occurrences, the signal appears on the Signals page, and the new-signal notification and any agent dispatch fire. Two things happen to candidates while they wait:- Near-duplicates are merged. When discovery splits one real problem into several near-identical candidates, Latitude combines them and counts their evidence together, so a problem can reach the threshold that none of its fragments would have reached alone. The promoted signal’s name and description are generated from the merged evidence.
- Idle candidates are dropped. A candidate that stops accumulating occurrences for 45 days is discarded, so a genuine one-off never lingers. If the pattern recurs later, it starts over as a new candidate.
5. Signals become monitors
Important signals can generate evaluations. These monitors watch live traffic for the same failure pattern, measure it over time, and detect regressions after you fix it. As new annotations, flagger matches, and scores arrive, Latitude can realign the evaluation so it stays calibrated to the latest signal.The Signals page
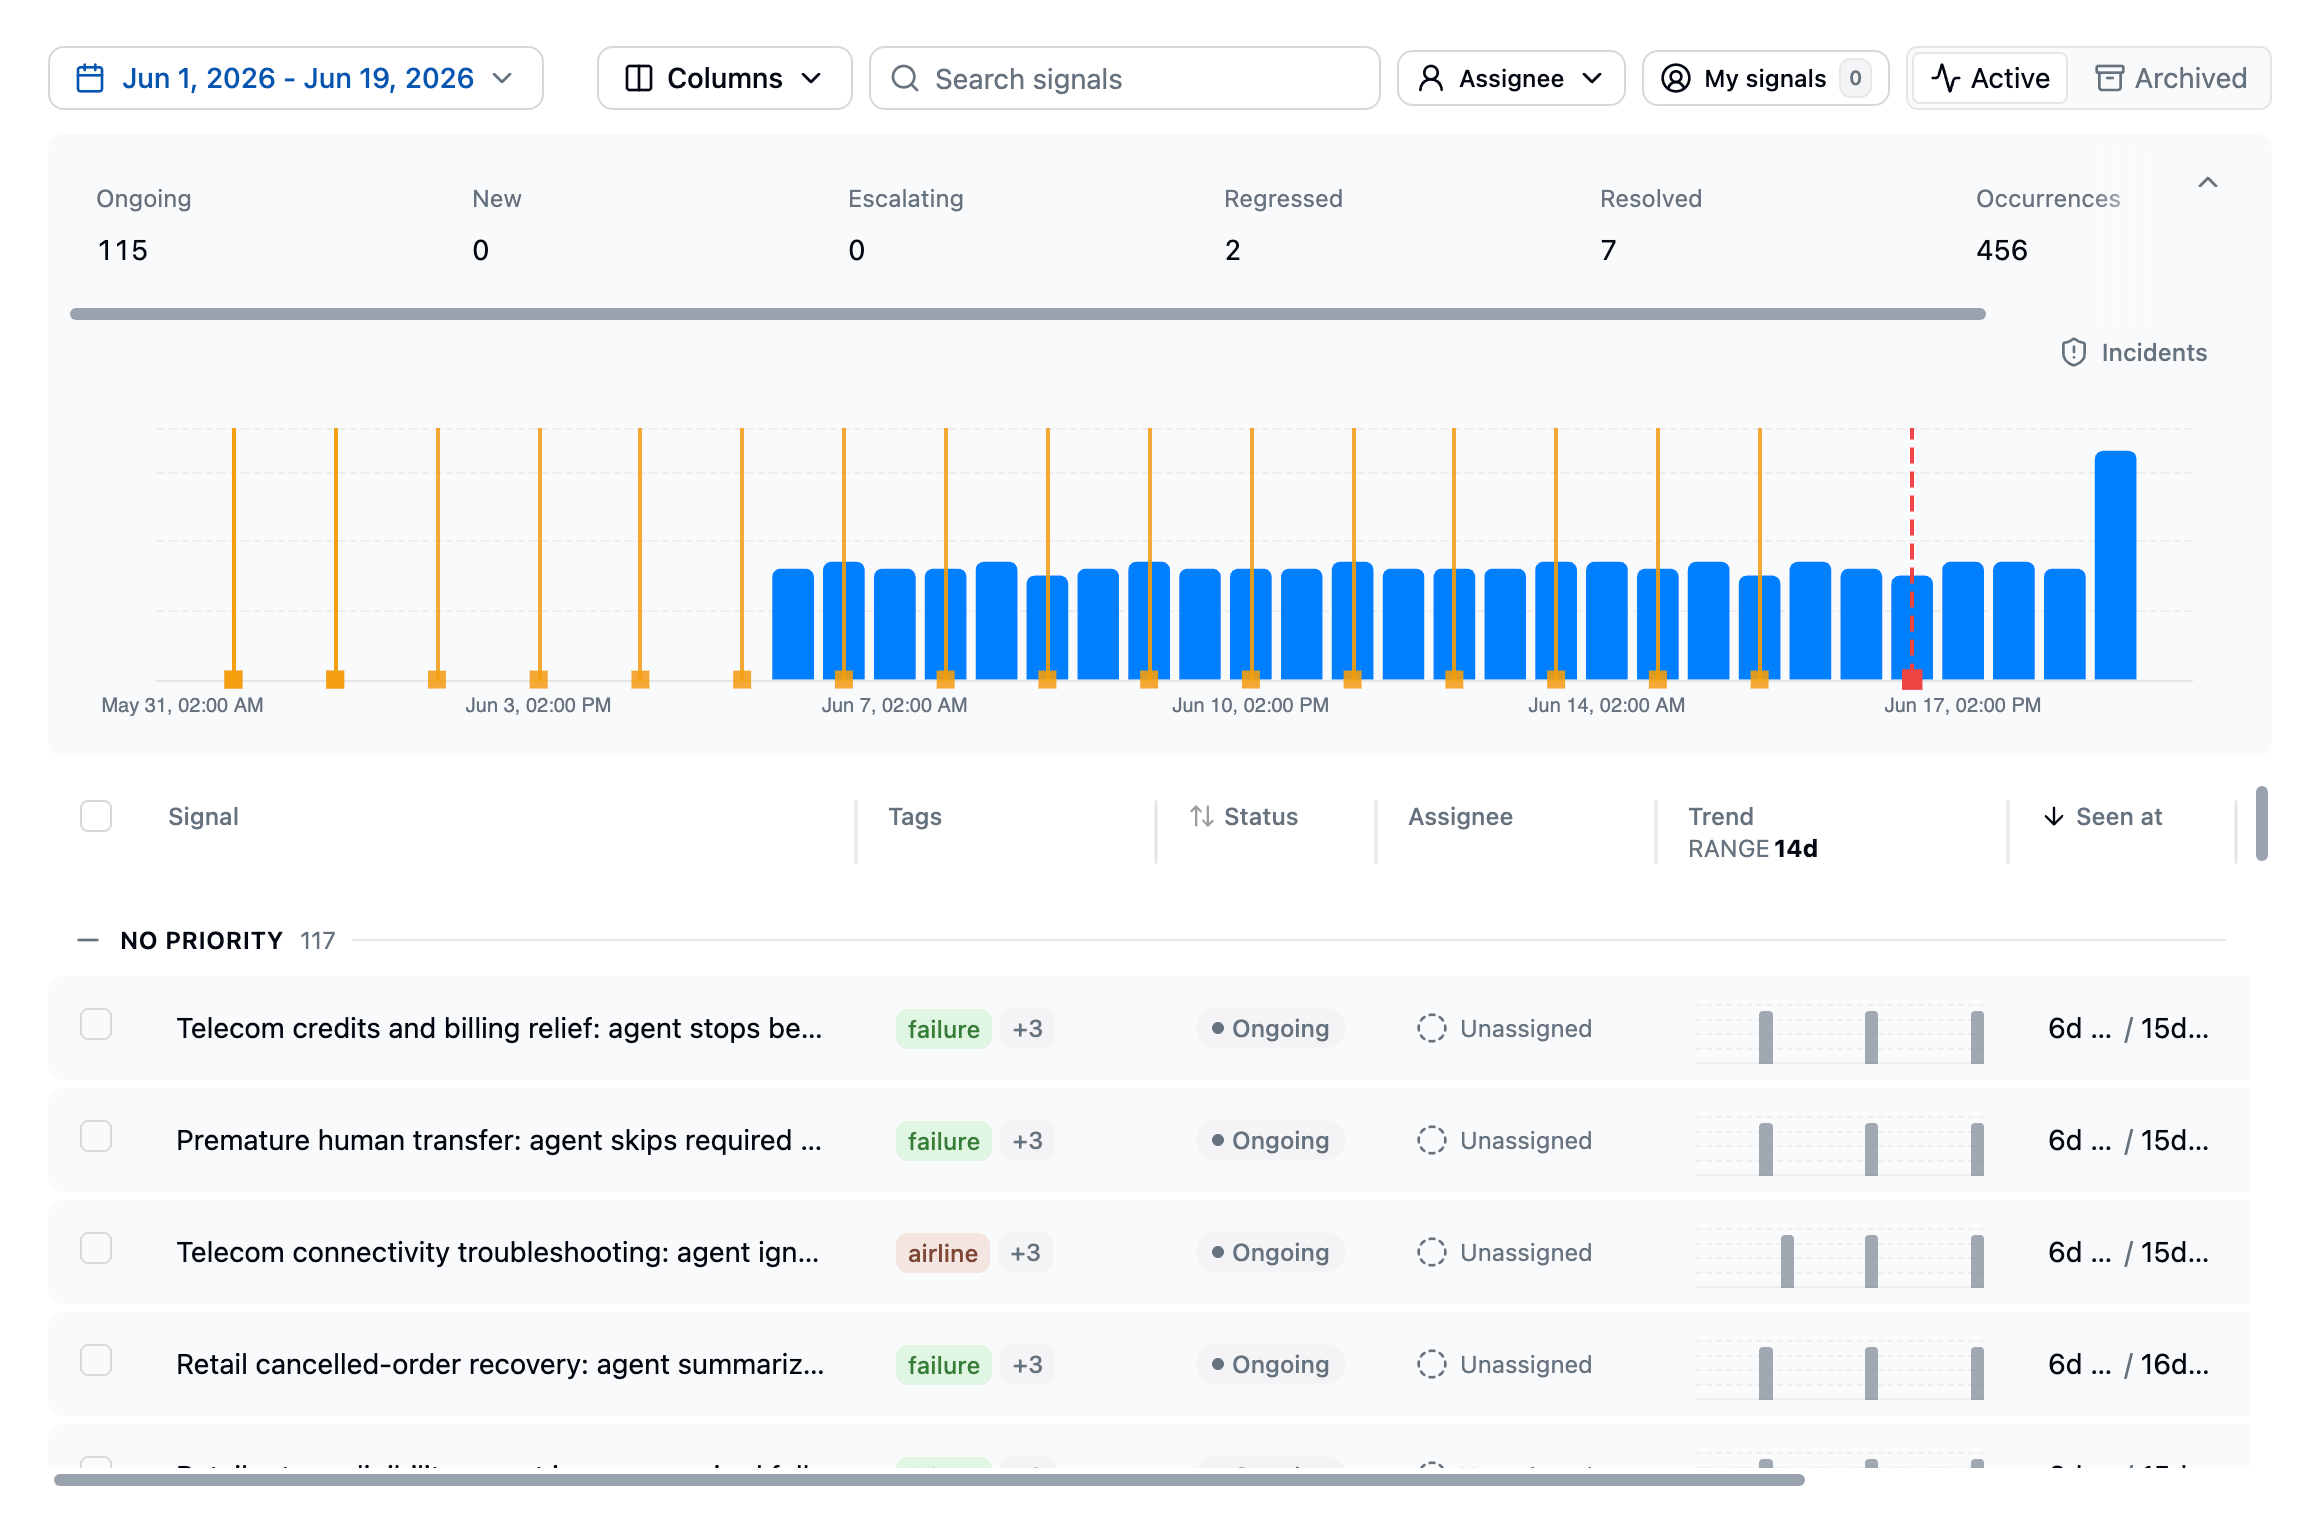
- Signal name: The generated name for the failure pattern
- Status: The current lifecycle state
- Trend: Recent occurrence activity
- Total events: How many times the signal has been detected
- Affected users: The percentage of users impacted
- Evaluations: Linked monitoring evaluations and their status
Signal detail
Click any signal to open its detail page: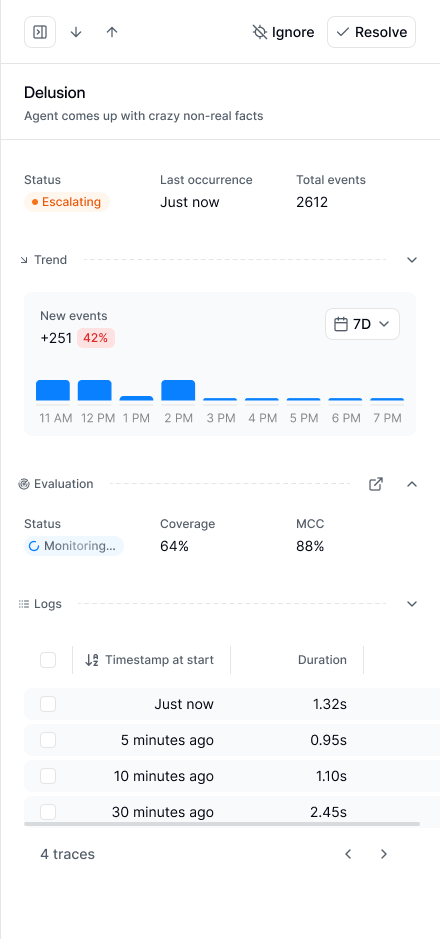
Signal lifecycle
A signal’s status is shown as chips on the signal:
A signal can hold more than one state at once. A signal created this week that is also spiking shows as both New and Escalating.
Two more markers appear alongside the state:
- Evaluated: the signal has an active evaluation checking new sessions. See Evaluations.
- Muted: notifications are silenced; the signal keeps tracking occurrences and opening incidents. See Signal management.
Common workflows
Investigate sessions
Use the signal’s example sessions to understand common user intents, missing context, tool failures, retrieval problems, prompt gaps, or model behavior that needs to change.Generate an evaluation
Choose Generate an evaluation to attach an automated detector to the signal. It scores new sessions and tracks whether the behavior is still happening. See Signal management.Triage, resolve, and ignore
Assign an owner and a priority so the right person picks it up. Priority uses the same low, medium, high, urgent scale as monitor alerts; raising a signal’s priority can notify your team, and escalation notifications for the signal inherit the higher of the incident’s severity and the signal’s priority. Resolve a signal once the underlying problem is fixed; Latitude reopens it and alerts you if it comes back. Ignore a signal that isn’t worth acting on: it moves to Archived, monitoring stops, and notifications are muted. Mute a signal you want to keep watching without the pings. For a signal you created that you no longer need, delete it.Grade a flagger’s signal
Signals detected by a flagger show a thumbs up/down control in the page header asking whether the signal was a real problem. A thumbs-up can be saved as is; a thumbs-down asks what made it a false positive and offers Save and ignore, which archives the signal in the same step. The verdict is one-time and cannot be changed, and it is sent to Latitude to grade the flagger’s own decision. It does not change how flaggers run on your project.Related pages
- Create a signal: Define a signal yourself
- Signal management: Triage, monitor, resolve, ignore, and manage signals
- Monitors: Watch saved searches, tools, users, and sessions
- Annotations: Leave human feedback on traces
- Flaggers: Detect common failure categories automatically
- Evaluations: Monitor known failure patterns
- Scores: Understand Latitude’s common measurement unit