Logs
Learn how to use the logs page to monitor your prompts and evaluate their performance.
Overview
Latitude stores all the logs generated by your prompts in a database. You can use the logs page to monitor your prompts and evaluate their performance.
How it works
Every time you run a prompt, from the API or from the UI, a new log is created.
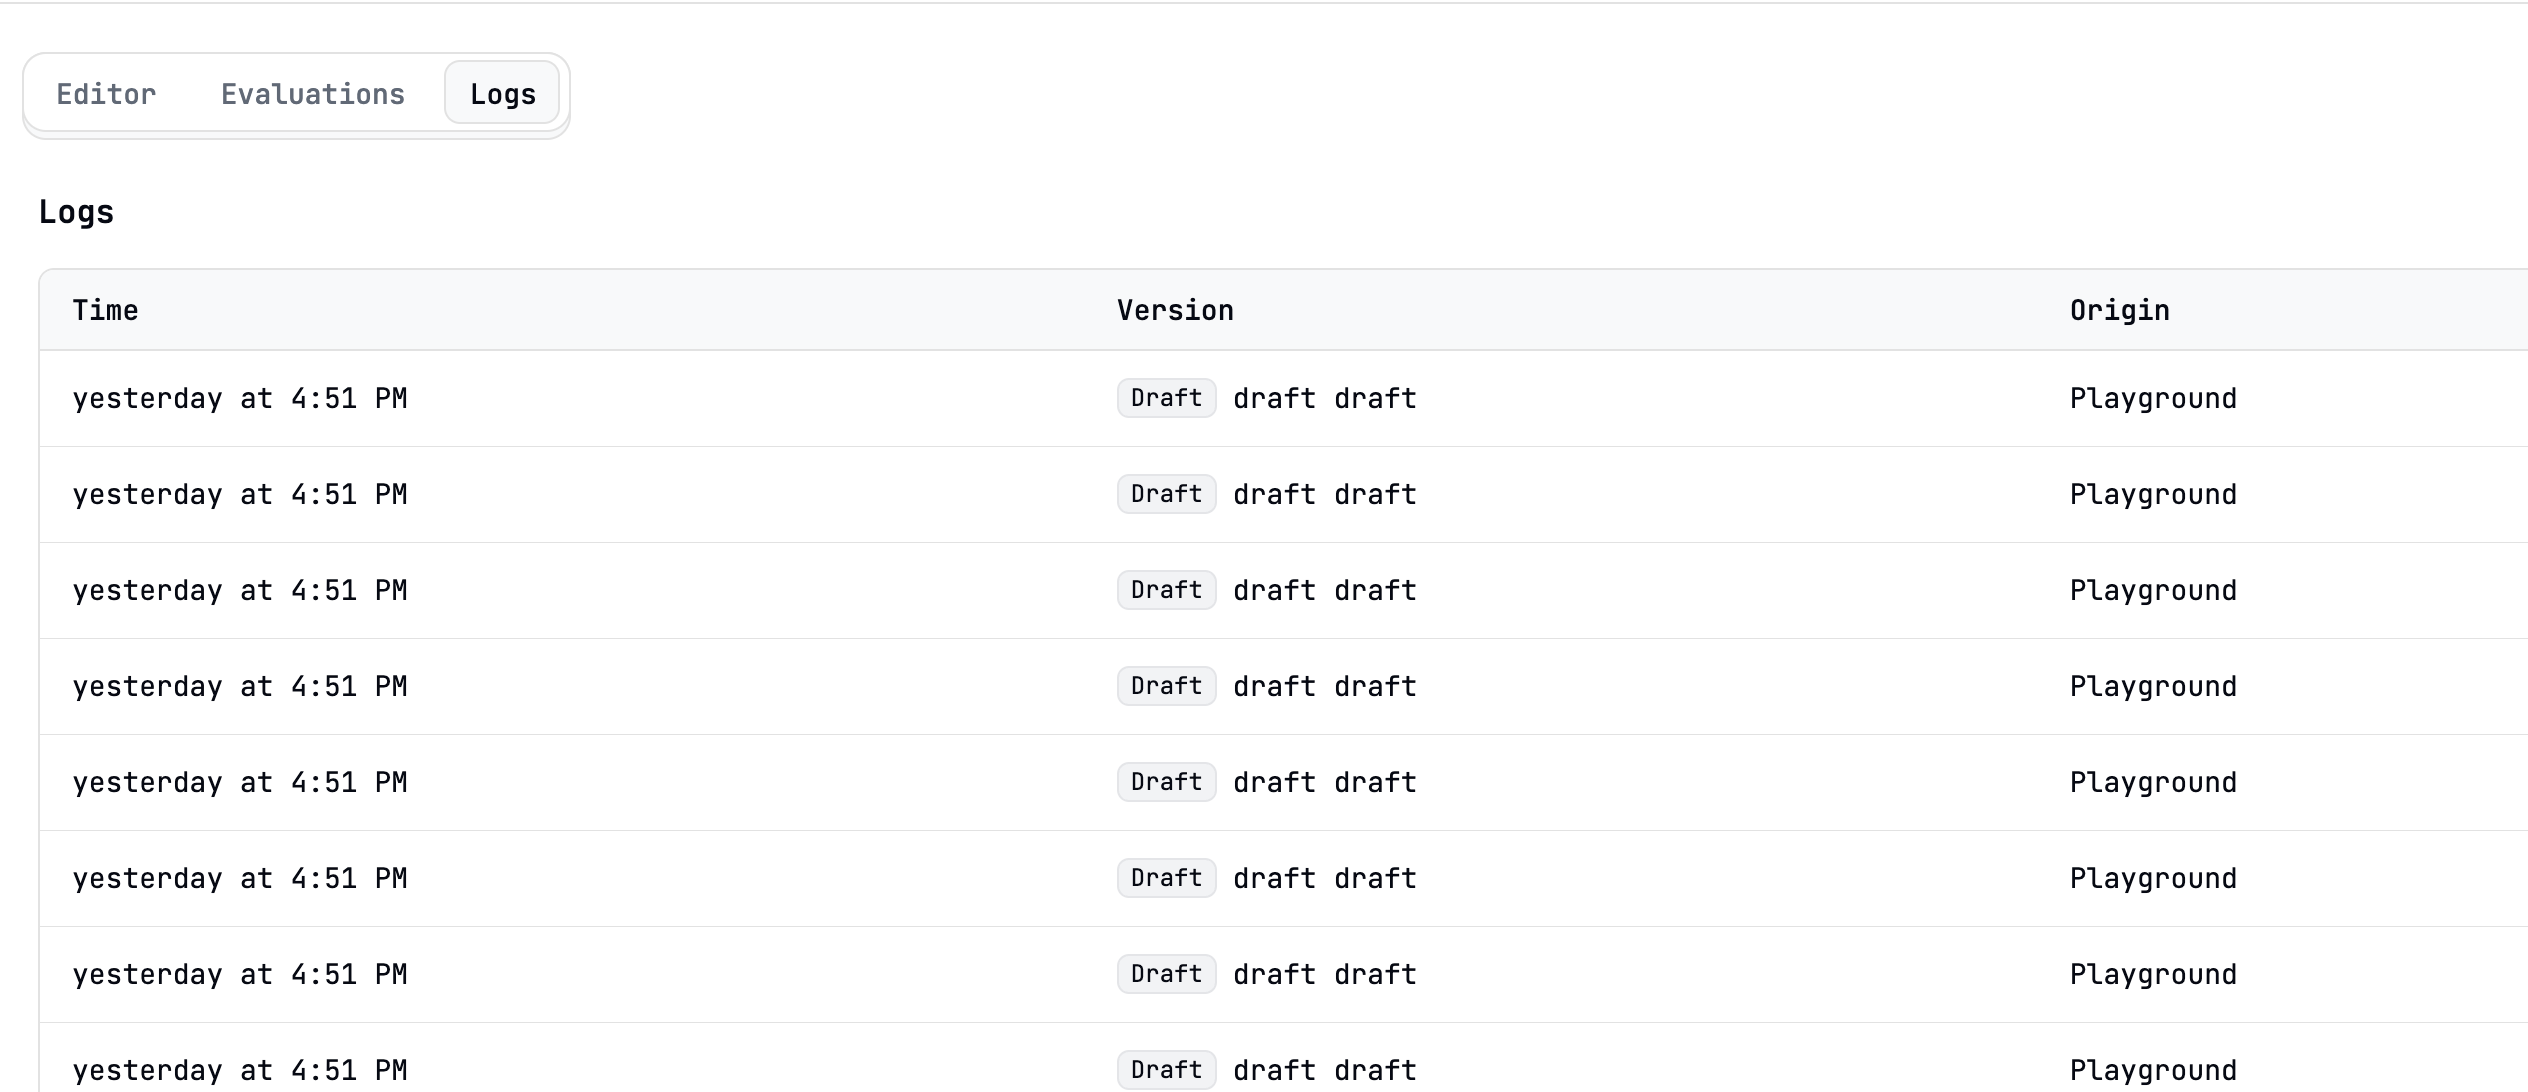
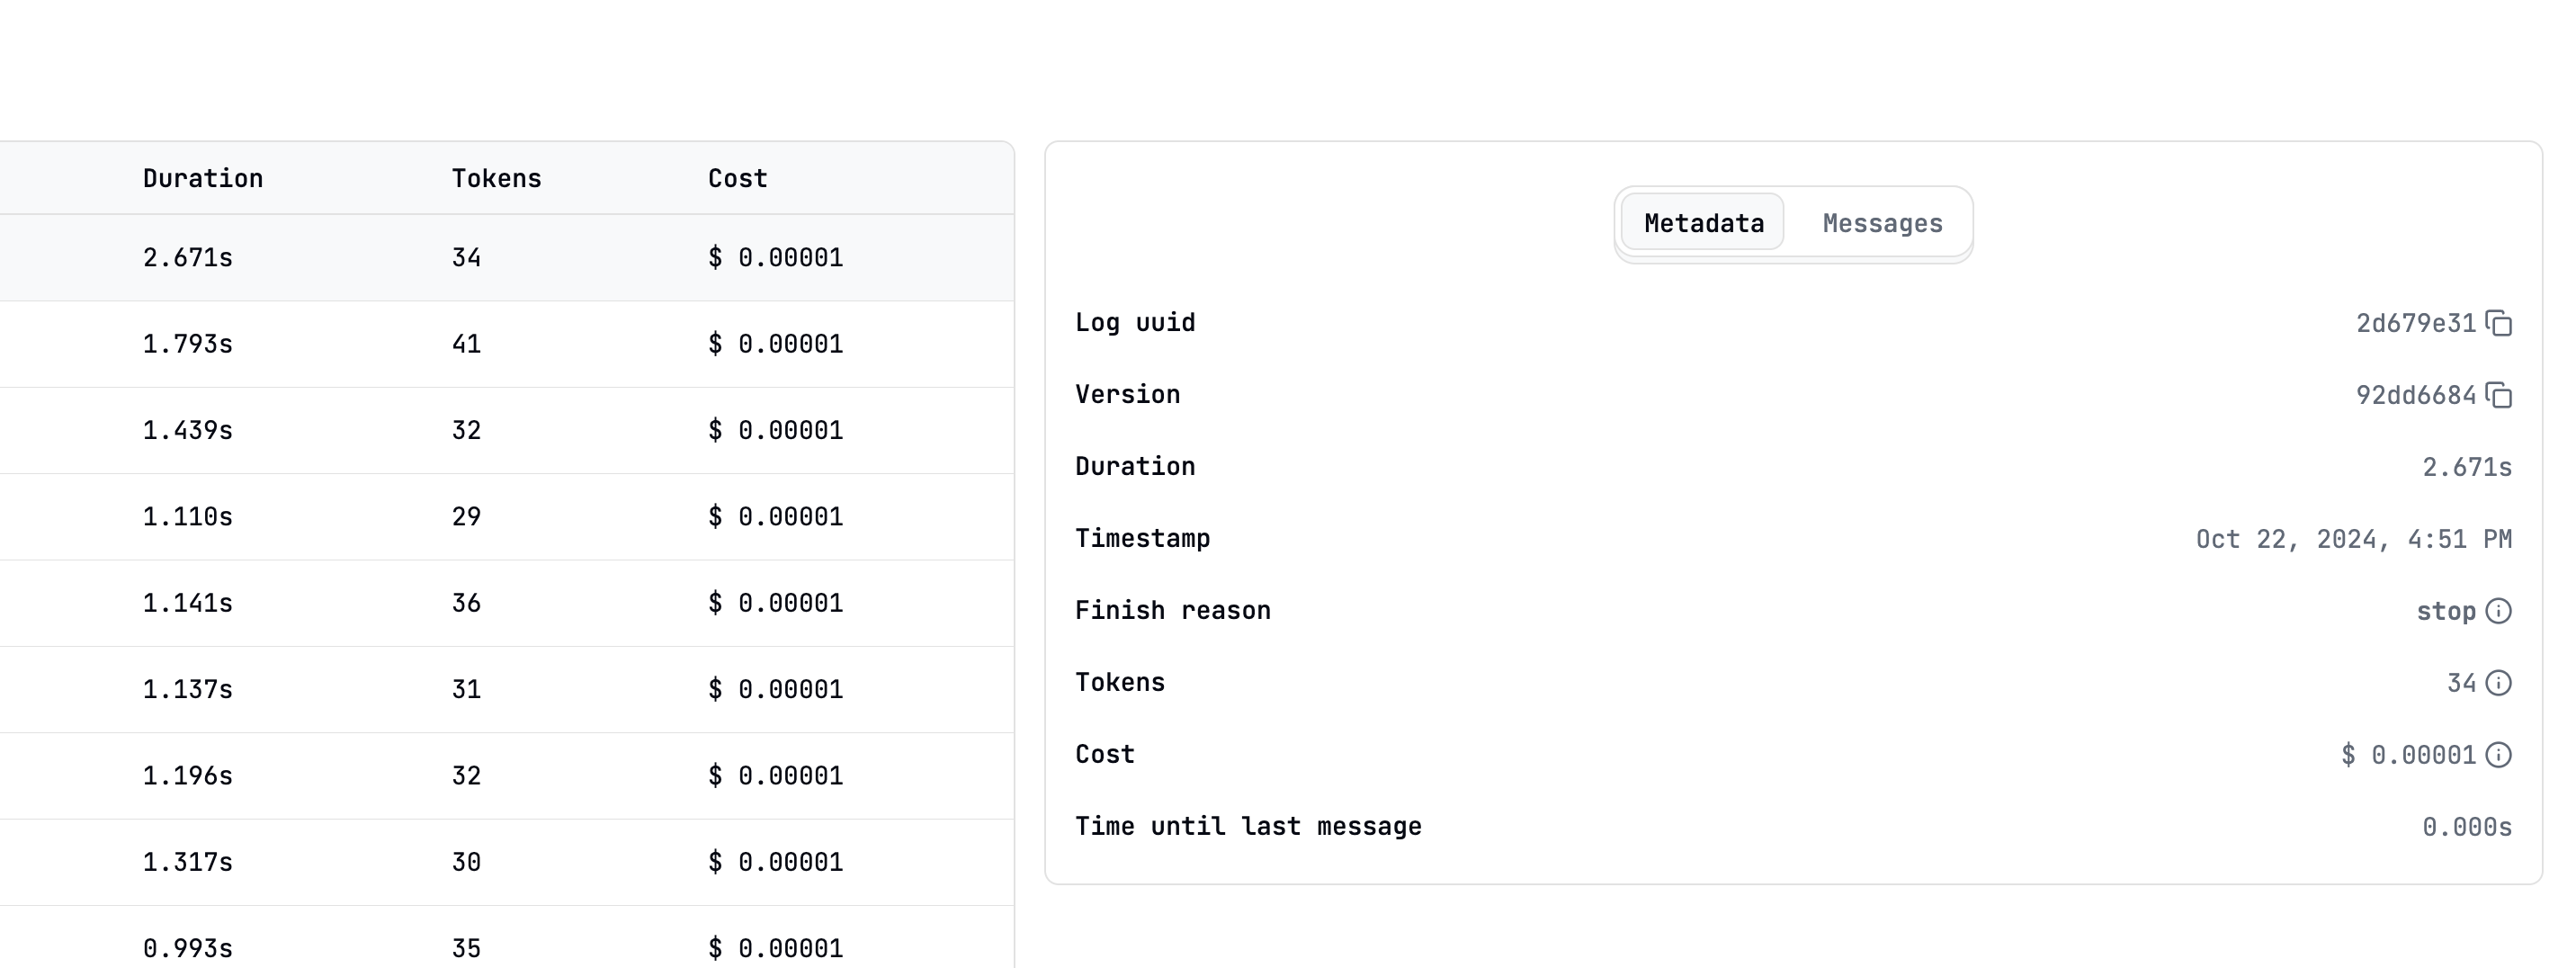
To access the logs page, navigate to a prompt and click on the “Logs” tab. You’ll see a table with all the logs generated by the prompt, some metadata like the timestamp, the prompt version used, latency, tokens used, and cost.
Clicking on a log will display a side panel with the full details of the log, including the list of messages.
Creating logs for evaluations
You can also create logs for evaluation purposes without actually running the prompt. This is useful when you want to run evaluations on a large number of inputs.
For a detailed guide on running evaluations in batches, refer to the Running Evaluations guide.
Coming soon
- Filtering and sorting
- Exporting logs to a CSV file
- Deleting logs
- Visualizations for certain metrics like latency, tokens used, and cost