> ## Documentation Index
> Fetch the complete documentation index at: https://docs.latitude.so/llms.txt
> Use this file to discover all available pages before exploring further.
# Signal discovery
> Understand how Latitude turns annotations, scores, evaluations, and flaggers into trackable production signals.
# Signal discovery
Signals are recurring failure patterns in your agent's production traffic. Latitude groups failed scores into signals, then gives each signal a name, examples, trends, and a lifecycle your team can act on.
The loop is simple: **find bad behavior, explain it, monitor it, fix it, and catch regressions**.
## How signal discovery works
```text theme={"theme":{"light":"github-light","dark":"github-dark"}}
Traces
↓
Annotations, flaggers, evaluations, and custom checks
↓
Scores
↓
Signal discovery
↓
Signals with examples, trends, status, and linked evaluations
```
### 1. Traces capture real behavior
Your telemetry sends real user and agent interactions into Latitude as traces. These traces are the raw material for signal discovery.
### 2. Signals produce scores
Latitude uses several signal sources to decide whether a trace represents good or bad behavior:
* **Annotations**: Human feedback left on traces during review.
* **Flaggers**: Built-in automatic annotators for categories such as frustration, refusal, jailbreaking, tool errors, and empty responses.
* **Evaluations**: Automated monitors that track signal patterns across incoming traces.
* **Custom scores**: Domain-specific verdicts you submit from your own systems.
All of these produce [scores](../scores/overview): Latitude's common unit for verdicts, feedback, analytics, and signal discovery.
### 3. Failed scores become signal candidates
When a score fails, Latitude compares its feedback and trace context against existing signals.
* If it matches an existing signal, the score becomes a new occurrence of that signal.
* If it does not match, Latitude can create a new signal with a generated name, description, and example traces.
You do not need to predefine every failure category. Latitude learns signal clusters from the failures that appear in your traffic.
### 4. Signals become monitors
Important signals can generate [evaluations](../evaluations/overview). These monitors watch live traffic for the same failure pattern, measure it over time, and detect regressions after you fix it.
As new annotations, flagger matches, and scores arrive, Latitude can realign the evaluation so it stays calibrated to the latest signal.
## The Signals page
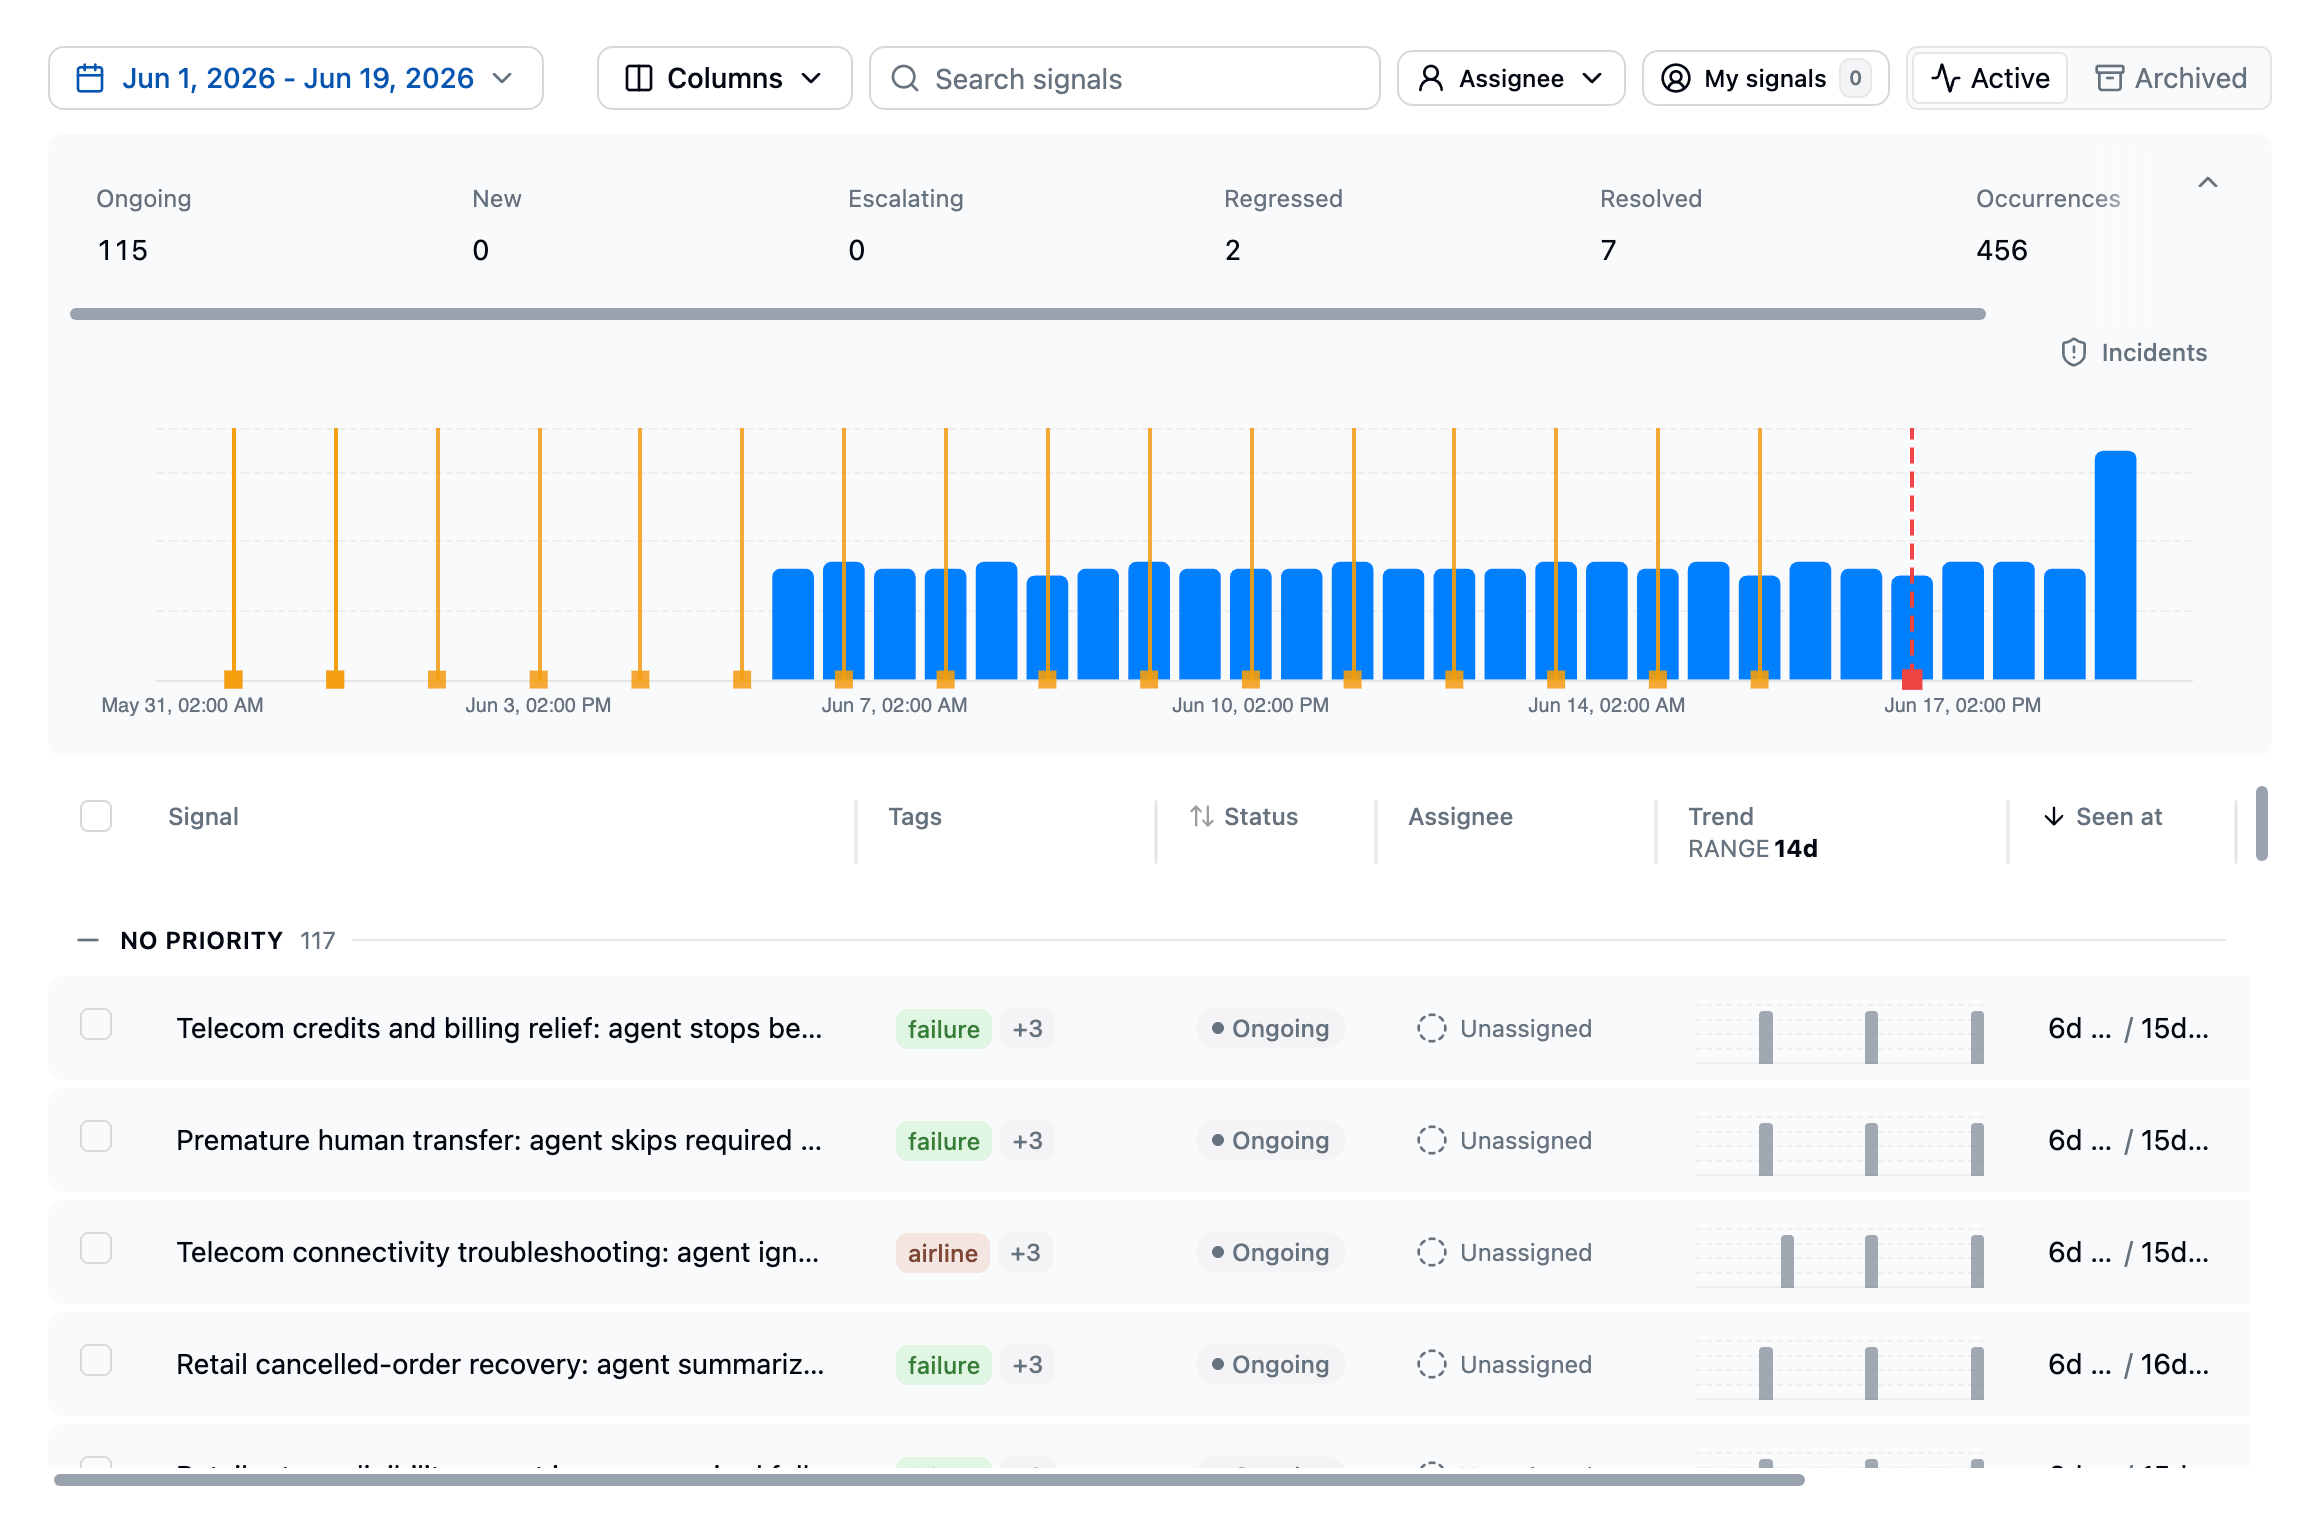 The Signals page shows discovered failure patterns for your project. Summary cards highlight regressions, escalating signals, active signals, new signals, and total events. A histogram shows signal occurrences over time.
The table lists each signal with:
* **Signal name**: The generated name for the failure pattern
* **Status**: The current lifecycle state
* **Trend**: Recent occurrence activity
* **Total events**: How many times the signal has been detected
* **Affected users**: The percentage of users impacted
* **Evaluations**: Linked monitoring evaluations and their status
Use the **Active / Inactive** tabs to switch between current signals and resolved or ignored ones.
## Signal detail
Click any signal to open its detail page:
The Signals page shows discovered failure patterns for your project. Summary cards highlight regressions, escalating signals, active signals, new signals, and total events. A histogram shows signal occurrences over time.
The table lists each signal with:
* **Signal name**: The generated name for the failure pattern
* **Status**: The current lifecycle state
* **Trend**: Recent occurrence activity
* **Total events**: How many times the signal has been detected
* **Affected users**: The percentage of users impacted
* **Evaluations**: Linked monitoring evaluations and their status
Use the **Active / Inactive** tabs to switch between current signals and resolved or ignored ones.
## Signal detail
Click any signal to open its detail page:
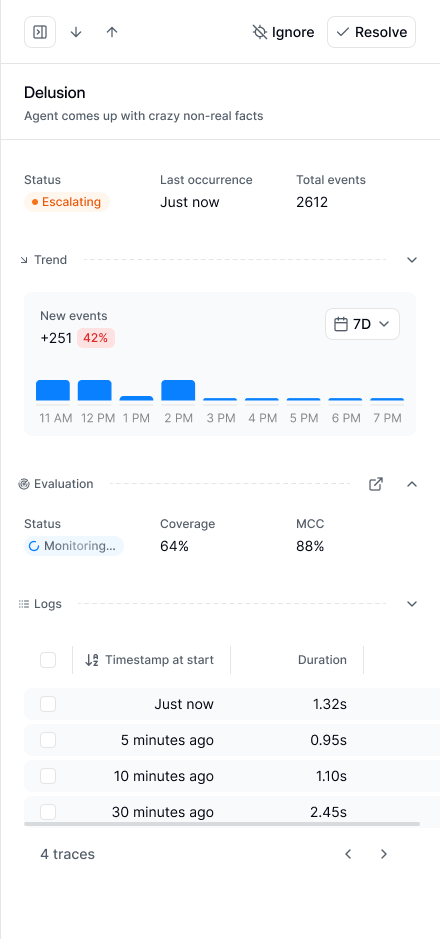 The signal page shows the signal description, lifecycle state, impact (affected traces, sessions, users, and cost), assignee and priority, a trend chart, recurring patterns, linked evaluations, an examples carousel, and the recent traces where the signal was detected. Open example traces to understand what triggered the signal and what the agent did wrong.
## Signal lifecycle
| State | Meaning |
| -------------- | ---------------------------------------------------------------- |
| **New** | Newly discovered |
| **Escalating** | Occurrences are increasing compared to the recent baseline |
| **Resolved** | Marked fixed or inactive |
| **Regressed** | New occurrences appeared after the signal was resolved |
| **Ignored** | Hidden from the active workflow because it is not worth tracking |
An signal can be in multiple states at once. For example, a newly discovered signal can also be escalating.
## Common workflows
### Investigate traces
Use the signal's example traces to understand common user intents, missing context, tool failures, retrieval problems, prompt gaps, or model behavior that needs to change.
### Generate an evaluation
Click **Generate Evaluation** to create an automated monitor for the signal. The evaluation runs on future traces and helps track whether the signal is still happening.
### Resolve or ignore
* **Resolve** when the underlying problem is fixed. Keep monitoring enabled if you want Latitude to catch regressions.
* **Ignore** when the signal is noise or not worth tracking. Ignored signals leave the active workflow.
## Related pages
* [Signal Management](./management): Triage, investigate, resolve, and ignore signals
* [Monitors](../monitors/overview): Get notified when signals are discovered, regress, or escalate
* [Annotations](../annotations/overview): Leave human feedback on traces
* [Flaggers](../annotations/flaggers): Detect common failure categories automatically
* [Evaluations](../evaluations/overview): Monitor known failure patterns
* [Scores](../scores/overview): Understand Latitude's common measurement unit
The signal page shows the signal description, lifecycle state, impact (affected traces, sessions, users, and cost), assignee and priority, a trend chart, recurring patterns, linked evaluations, an examples carousel, and the recent traces where the signal was detected. Open example traces to understand what triggered the signal and what the agent did wrong.
## Signal lifecycle
| State | Meaning |
| -------------- | ---------------------------------------------------------------- |
| **New** | Newly discovered |
| **Escalating** | Occurrences are increasing compared to the recent baseline |
| **Resolved** | Marked fixed or inactive |
| **Regressed** | New occurrences appeared after the signal was resolved |
| **Ignored** | Hidden from the active workflow because it is not worth tracking |
An signal can be in multiple states at once. For example, a newly discovered signal can also be escalating.
## Common workflows
### Investigate traces
Use the signal's example traces to understand common user intents, missing context, tool failures, retrieval problems, prompt gaps, or model behavior that needs to change.
### Generate an evaluation
Click **Generate Evaluation** to create an automated monitor for the signal. The evaluation runs on future traces and helps track whether the signal is still happening.
### Resolve or ignore
* **Resolve** when the underlying problem is fixed. Keep monitoring enabled if you want Latitude to catch regressions.
* **Ignore** when the signal is noise or not worth tracking. Ignored signals leave the active workflow.
## Related pages
* [Signal Management](./management): Triage, investigate, resolve, and ignore signals
* [Monitors](../monitors/overview): Get notified when signals are discovered, regress, or escalate
* [Annotations](../annotations/overview): Leave human feedback on traces
* [Flaggers](../annotations/flaggers): Detect common failure categories automatically
* [Evaluations](../evaluations/overview): Monitor known failure patterns
* [Scores](../scores/overview): Understand Latitude's common measurement unit