> ## Documentation Index
> Fetch the complete documentation index at: https://docs.latitude.so/llms.txt
> Use this file to discover all available pages before exploring further.
# Saved Searches
> Bookmark useful search queries and filter sets, then reopen them from the Saved searches dropdown
# Saved Searches
A saved search is a reusable search query, filter set, or both. Save it once, then return to the same cohort from the **Saved searches** dropdown on the Traces page.
 ## What a Saved Search Stores
Each saved search stores:
* **A query**: The text from the search bar, if any
* **A filter set**: The filters active when you saved, if any
* **A name**: A human-readable label
A saved search must include a query, filters, or both. *"All errors in production this week"* might use only filters; *"jailbreak attempts"* might use only a query.
Saved searches are project-scoped. Two projects can have saved searches with the same name; they're independent.
## The Saved searches dropdown
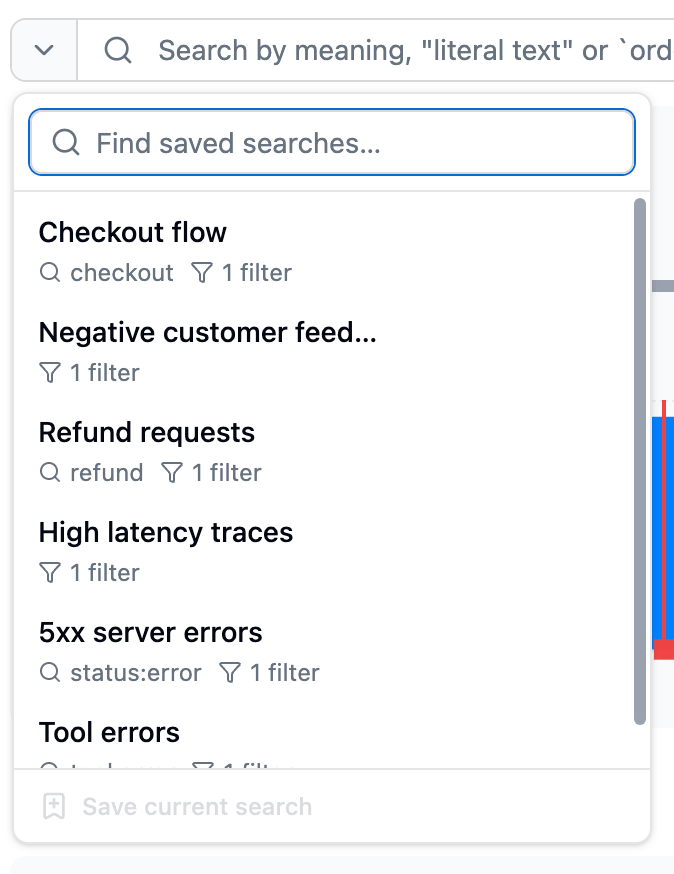
Saved searches live in the **Saved searches** dropdown, on the left of the search bar on the Traces page. Open it to see every saved search in the project. Each row shows:
| Element | What it shows |
| ----------- | --------------------------------------------------------- |
| **Name** | The label you gave the saved search |
| **Query** | A preview of the search text, if the saved search has one |
| **Filters** | How many filters are part of the saved search |
Use the filter box at the top of the dropdown to find a saved search by name. Click a row to reopen the saved search with its query and filters restored. Hovering a row also reveals actions to create or view a [monitor](../monitors/overview), rename, and delete (see below).
## Creating a Saved Search
1. On the **Traces** page, run a query, apply filters, or both.
2. Click **Save search**, or open the **Saved searches** dropdown and click **Save current search** at the bottom.
3. Give it a descriptive name and confirm.
The saved search becomes active right away, and the new entry appears in the **Saved searches** dropdown.
Good names describe what's in the cohort, not how you searched for it. *"Failed payments last week"* is more useful at a glance than *"q: payment errors filter: status=error"*.
## Renaming and Deleting
Hover a row in the **Saved searches** dropdown to reveal its actions, then rename or delete the saved search. Deleting removes only the bookmark; the underlying traces are not affected. Deleting a saved search also removes any [monitor](../monitors/overview) alerts watching it.
## Editing a Saved Search
When you change the query or filters on a loaded saved search, Latitude shows two actions:
* **Update saved search**: Overwrite the saved search with the current query and filters.
* **Save as new search**: Keep the original and create a new saved search from the current state.
Use **Update saved search** for changes you want to keep, such as expanding the time range from 7 to 30 days. Use **Save as new search** when you want a sibling search, such as one that adds a model filter.
The update action is disabled until there's a change to save.
## Workflows
### Investigate a specific cohort
You're investigating reports that the agent gets confused during multi-turn checkout flows.
1. Run a search like `"checkout"` and add a filter for `metadata.flow = "checkout"` and `spanCount >= 5`.
2. Save it as *"Checkout flows over 5 steps"*.
3. Work through the matches, opening each trace to inspect and annotate it.
4. Reopen the saved search whenever you want to return to the same cohort.
### Watch for a recurring issue
You've resolved a tool-retry issue and want to make sure it doesn't return.
1. Run a search filtered to the relevant tag or metadata.
2. Save it as *"Tool retry regressions"*.
3. Reopen it whenever you want to check, or point a [monitor](../monitors/overview) at it to be alerted automatically when matching traces arrive.
### Share a cohort with a teammate
You've found interesting jailbreak attempts and want a teammate to review them.
1. Save the search with a clear name.
2. Tell your teammate the name.
3. Saved searches are shared across the project, so they'll find it in the **Saved searches** dropdown.
## What Saved Searches Don't Do
Saved searches are bookmarks, not subscriptions. On their own they don't notify you, generate evaluation scores, or run background processing when a new trace matches. To get **alerted** when matching traces start arriving, spike, or stay elevated, point a [monitor](../monitors/overview) at the saved search. For automated detection that produces scores and feeds signal discovery, see [Flaggers](../annotations/flaggers).
## Next Steps
* [Monitors](../monitors/overview): Alert on a saved search when matching traces arrive, spike, or stay elevated
* [Search Overview](./overview): How search itself works
* [Flaggers](../annotations/flaggers): Automatic annotators for common failure categories
* [Inline Annotations](../annotations/inline-annotations): Leave feedback on traces from your saved search
* [Filters](../observability/filters): The shared filter system used inside searches
## What a Saved Search Stores
Each saved search stores:
* **A query**: The text from the search bar, if any
* **A filter set**: The filters active when you saved, if any
* **A name**: A human-readable label
A saved search must include a query, filters, or both. *"All errors in production this week"* might use only filters; *"jailbreak attempts"* might use only a query.
Saved searches are project-scoped. Two projects can have saved searches with the same name; they're independent.
## The Saved searches dropdown
Saved searches live in the **Saved searches** dropdown, on the left of the search bar on the Traces page. Open it to see every saved search in the project. Each row shows:
| Element | What it shows |
| ----------- | --------------------------------------------------------- |
| **Name** | The label you gave the saved search |
| **Query** | A preview of the search text, if the saved search has one |
| **Filters** | How many filters are part of the saved search |
Use the filter box at the top of the dropdown to find a saved search by name. Click a row to reopen the saved search with its query and filters restored. Hovering a row also reveals actions to create or view a [monitor](../monitors/overview), rename, and delete (see below).
## Creating a Saved Search
1. On the **Traces** page, run a query, apply filters, or both.
2. Click **Save search**, or open the **Saved searches** dropdown and click **Save current search** at the bottom.
3. Give it a descriptive name and confirm.
The saved search becomes active right away, and the new entry appears in the **Saved searches** dropdown.
Good names describe what's in the cohort, not how you searched for it. *"Failed payments last week"* is more useful at a glance than *"q: payment errors filter: status=error"*.
## Renaming and Deleting
Hover a row in the **Saved searches** dropdown to reveal its actions, then rename or delete the saved search. Deleting removes only the bookmark; the underlying traces are not affected. Deleting a saved search also removes any [monitor](../monitors/overview) alerts watching it.
## Editing a Saved Search
When you change the query or filters on a loaded saved search, Latitude shows two actions:
* **Update saved search**: Overwrite the saved search with the current query and filters.
* **Save as new search**: Keep the original and create a new saved search from the current state.
Use **Update saved search** for changes you want to keep, such as expanding the time range from 7 to 30 days. Use **Save as new search** when you want a sibling search, such as one that adds a model filter.
The update action is disabled until there's a change to save.
## Workflows
### Investigate a specific cohort
You're investigating reports that the agent gets confused during multi-turn checkout flows.
1. Run a search like `"checkout"` and add a filter for `metadata.flow = "checkout"` and `spanCount >= 5`.
2. Save it as *"Checkout flows over 5 steps"*.
3. Work through the matches, opening each trace to inspect and annotate it.
4. Reopen the saved search whenever you want to return to the same cohort.
### Watch for a recurring issue
You've resolved a tool-retry issue and want to make sure it doesn't return.
1. Run a search filtered to the relevant tag or metadata.
2. Save it as *"Tool retry regressions"*.
3. Reopen it whenever you want to check, or point a [monitor](../monitors/overview) at it to be alerted automatically when matching traces arrive.
### Share a cohort with a teammate
You've found interesting jailbreak attempts and want a teammate to review them.
1. Save the search with a clear name.
2. Tell your teammate the name.
3. Saved searches are shared across the project, so they'll find it in the **Saved searches** dropdown.
## What Saved Searches Don't Do
Saved searches are bookmarks, not subscriptions. On their own they don't notify you, generate evaluation scores, or run background processing when a new trace matches. To get **alerted** when matching traces start arriving, spike, or stay elevated, point a [monitor](../monitors/overview) at the saved search. For automated detection that produces scores and feeds signal discovery, see [Flaggers](../annotations/flaggers).
## Next Steps
* [Monitors](../monitors/overview): Alert on a saved search when matching traces arrive, spike, or stay elevated
* [Search Overview](./overview): How search itself works
* [Flaggers](../annotations/flaggers): Automatic annotators for common failure categories
* [Inline Annotations](../annotations/inline-annotations): Leave feedback on traces from your saved search
* [Filters](../observability/filters): The shared filter system used inside searches