> ## Documentation Index
> Fetch the complete documentation index at: https://docs.latitude.so/llms.txt
> Use this file to discover all available pages before exploring further.
# Behaviours
> Browse the topics Latitude automatically discovers across your sessions, with trends and outcome metrics, to find what matters without writing a search.
**Where this fits:** Behaviours are part of the **Understand** section. Search finds what you
already know to look for; behaviours surface what you didn't.
The **Behaviours** page shows topics that Latitude automatically discovers by clustering your [sessions](../getting-started/concepts) by meaning. Instead of starting from a query, you start from a map of what your users are actually doing, and how each behaviour is trending.
 ## What you see
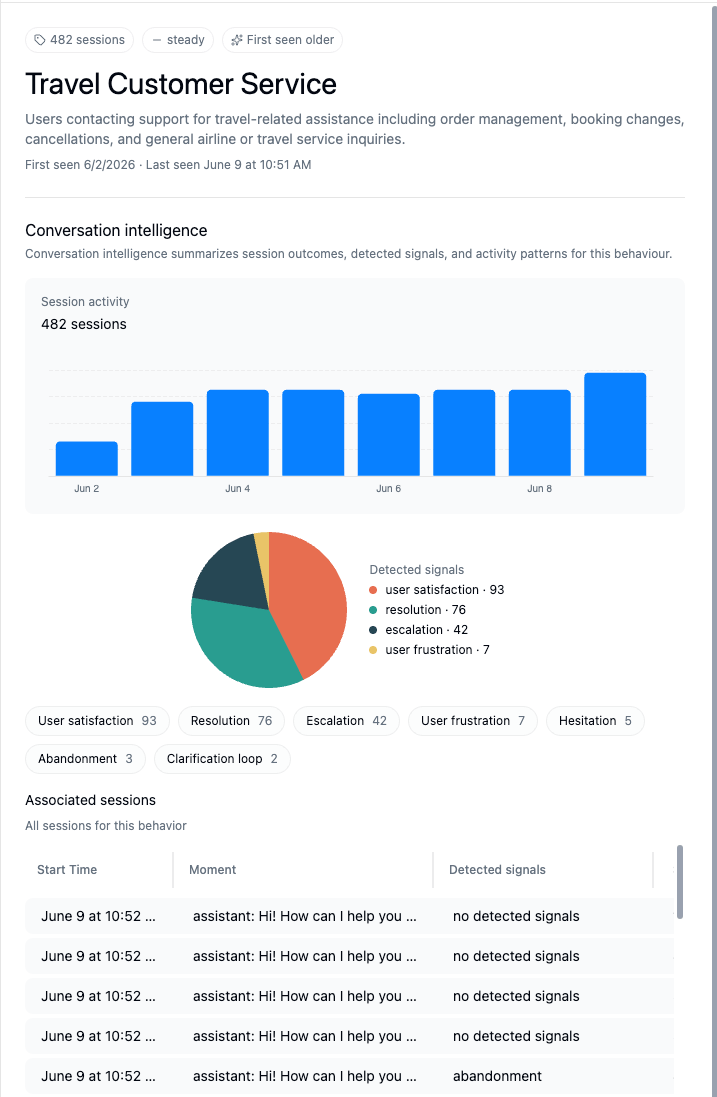
Behaviours are organized as a hierarchy of topics and subtopics that emerge from your data. For each behaviour, the page shows:
* a **trend**: for example new, spiking, rising, steady, cooling, or fading
* the **number of sessions** in that behaviour
* outcome metrics such as escalation rate, resolution rate, churn risk, and wins
You can filter by time range and segment the list, for example **All**, **New this week**, or **Spiking**: to focus on what changed.
Live behaviours appear after Latitude has clustered enough sessions. Until then, the page guides
you to send more traffic.
## Inspect a behaviour
Open any behaviour to see representative example sessions and how the topic has evolved over time. From there you can review the underlying [traces](../observability/traces), [annotate](../annotations/overview) them, and let recurring failures flow into [Signals](../signals/overview).
## What you see
Behaviours are organized as a hierarchy of topics and subtopics that emerge from your data. For each behaviour, the page shows:
* a **trend**: for example new, spiking, rising, steady, cooling, or fading
* the **number of sessions** in that behaviour
* outcome metrics such as escalation rate, resolution rate, churn risk, and wins
You can filter by time range and segment the list, for example **All**, **New this week**, or **Spiking**: to focus on what changed.
Live behaviours appear after Latitude has clustered enough sessions. Until then, the page guides
you to send more traffic.
## Inspect a behaviour
Open any behaviour to see representative example sessions and how the topic has evolved over time. From there you can review the underlying [traces](../observability/traces), [annotate](../annotations/overview) them, and let recurring failures flow into [Signals](../signals/overview).
 ## Filter searches by topic
The same topics are available as a **Topics** filter in [Search](./overview), so you can narrow any search to a specific behaviour and combine it with semantic, text, and metadata filters.
## Next step
* [Saved searches](./saved-searches): bookmark a behaviour or query and review it over time.
* [Signals](../signals/overview): turn recurring failures in a behaviour into a tracked signal.
## Filter searches by topic
The same topics are available as a **Topics** filter in [Search](./overview), so you can narrow any search to a specific behaviour and combine it with semantic, text, and metadata filters.
## Next step
* [Saved searches](./saved-searches): bookmark a behaviour or query and review it over time.
* [Signals](../signals/overview): turn recurring failures in a behaviour into a tracked signal.