> ## Documentation Index
> Fetch the complete documentation index at: https://docs.latitude.so/llms.txt
> Use this file to discover all available pages before exploring further.
# Users
> Review activity, sessions, and errors by end user.
# Users
The Users page groups telemetry by the end-user identifier you send with each trace. Use it to see who is using your product, when they were last active, and which traces or sessions are associated with them.
 ## Send user identifiers
Attach a stable user id when you capture a trace. You can also send a user email when it is useful for support workflows.
```ts theme={"theme":{"light":"github-light","dark":"github-dark"}}
import { capture } from "@latitude-data/telemetry"
await capture(
"support-agent-turn",
async () => {
return agent.run(userMessage)
},
{
userId: user.id,
userEmail: user.email,
},
)
```
```python theme={"theme":{"light":"github-light","dark":"github-dark"}}
from latitude_telemetry import capture
capture(
"support-agent-turn",
lambda: agent.run(user_message),
{
"user_id": user.id,
"user_email": user.email,
},
)
```
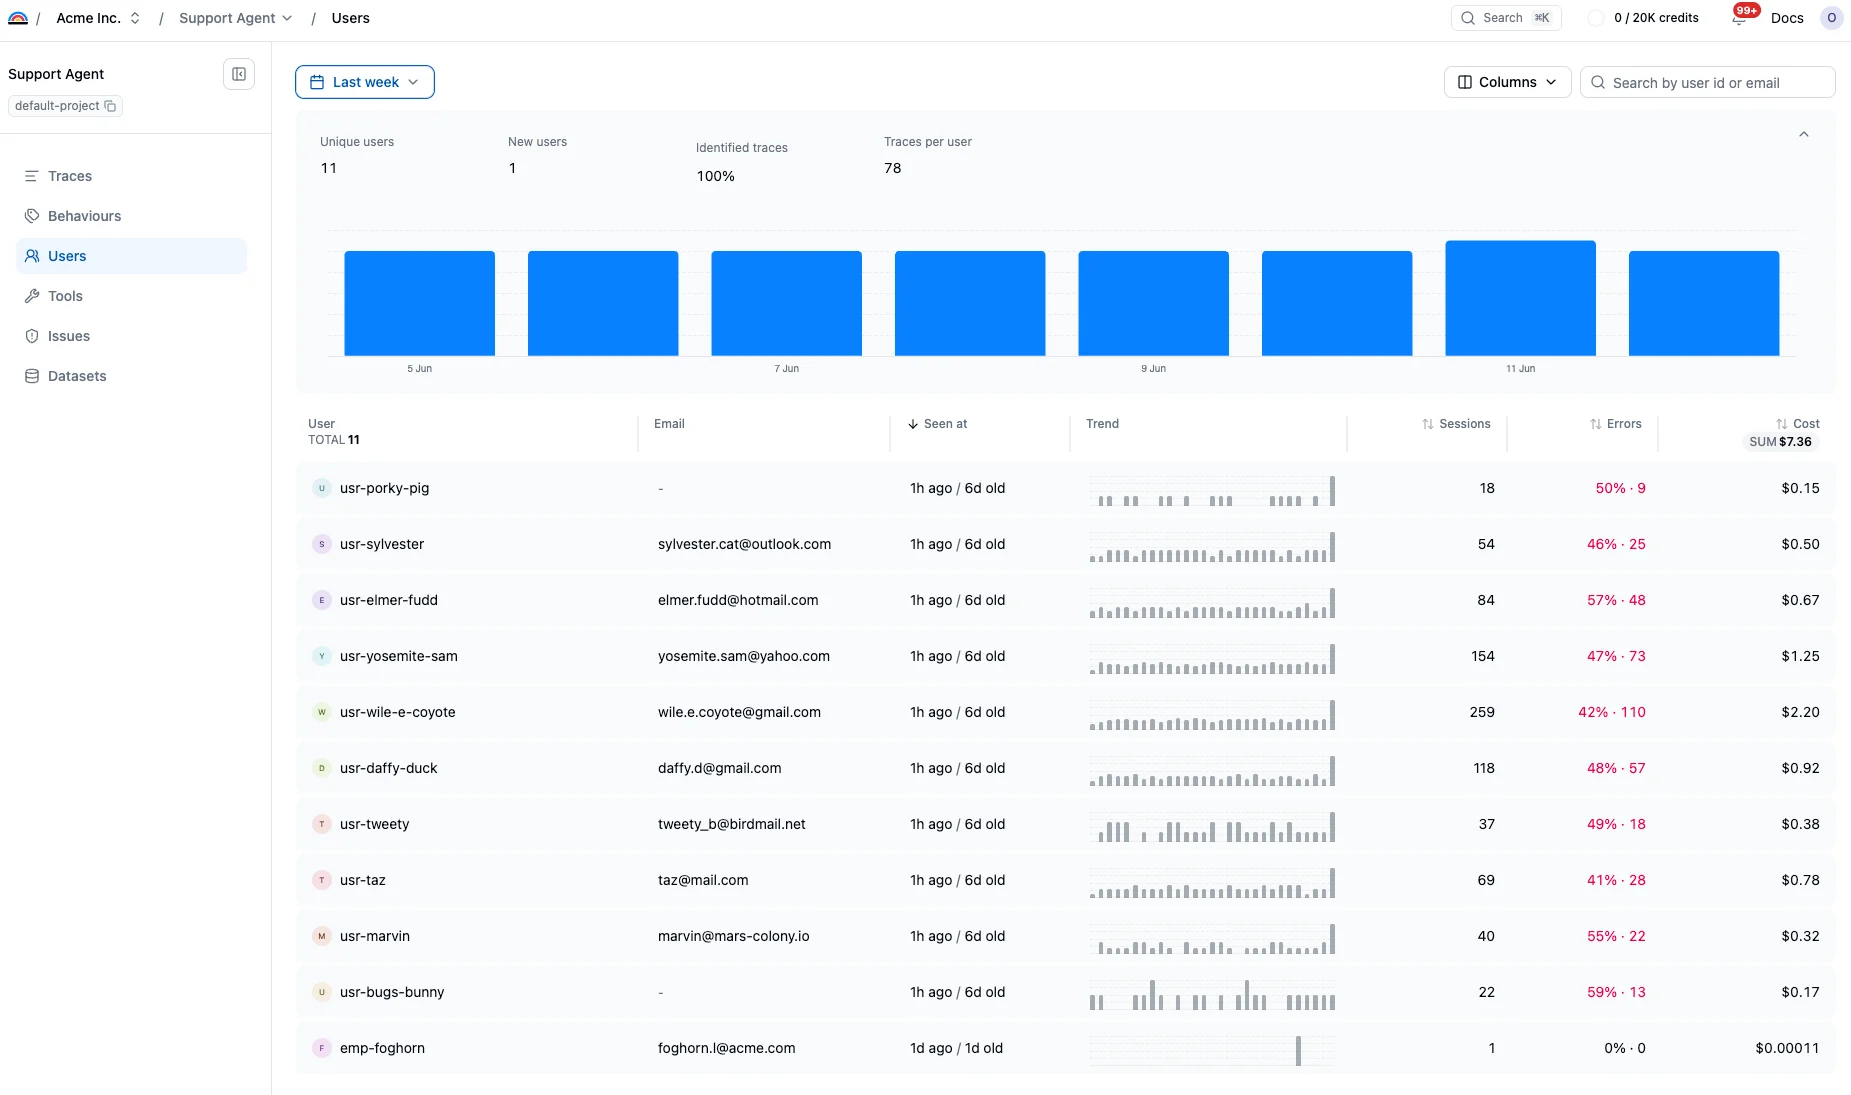
## The users dashboard
The dashboard opens with aggregate metrics for the selected time range — unique users, new users, the share of traces carrying a user id, and traces per user — above an activity histogram. Drag across the histogram to zoom into a narrower period.
Below, the table shows one row per user:
* **Seen at**: last and first activity within the selected period
* **Trend**: a per-user activity sparkline
* **Sessions**: distinct sessions in the period
* **Errors**: the rate and count of sessions with at least one errored trace
* **Cost**: per-user spend, with a column rollup you can cycle between SUM, AVG, and MED
Use the time range, column selector, and search controls to focus on a subset of users. Search matches user ids and emails, and every column with a sort icon is sortable.
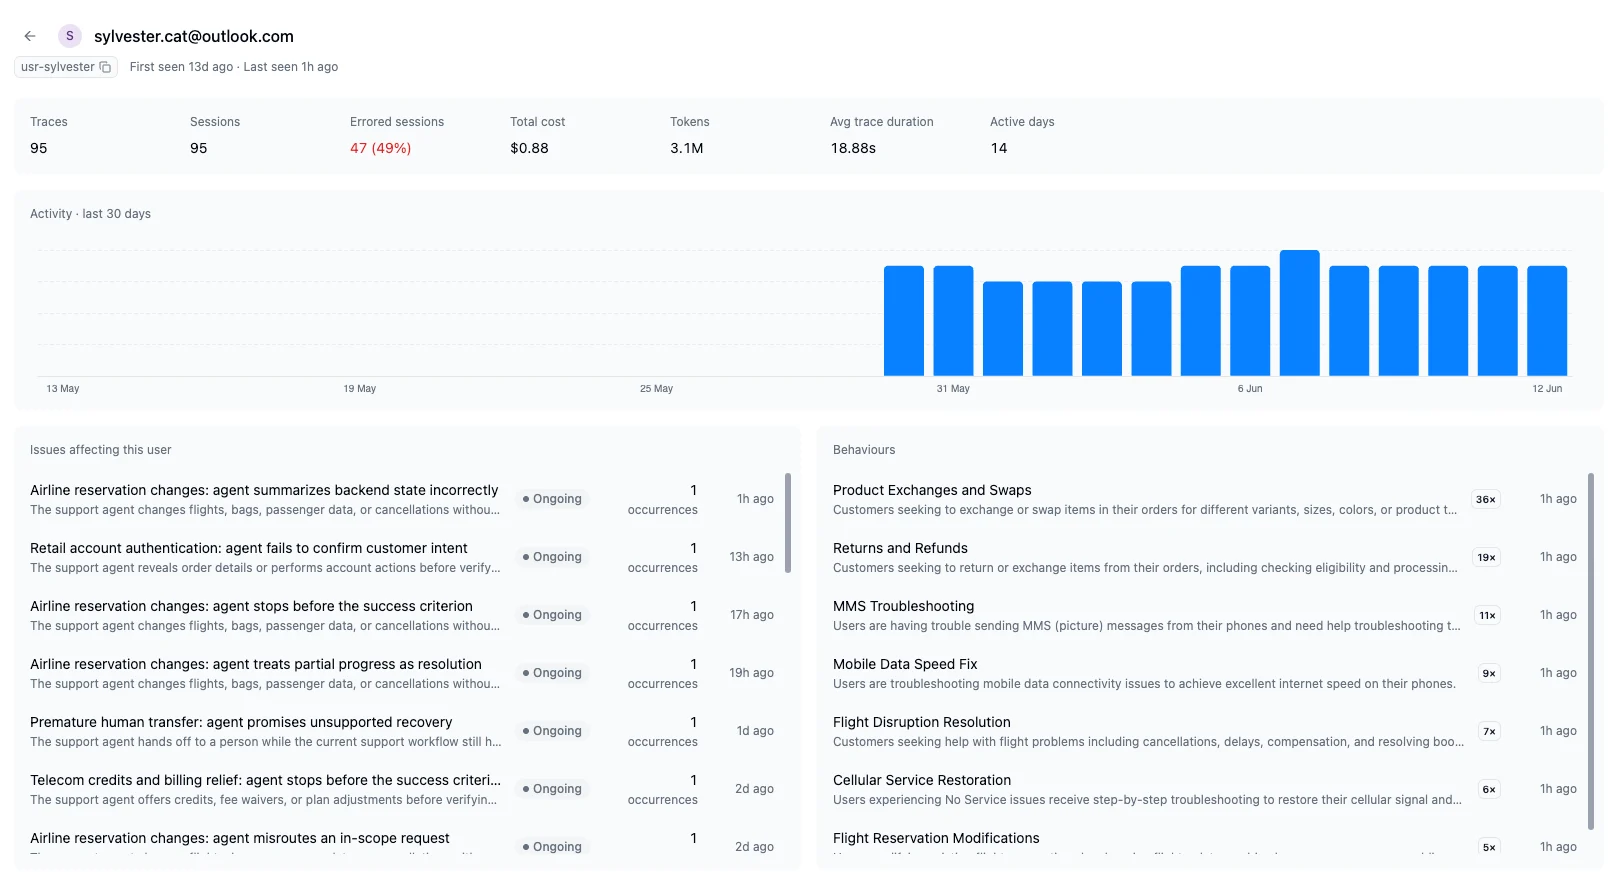
## User detail
Open a user to see their lifetime profile: traces, sessions, errored sessions, cost, tokens, average trace duration, and active days, alongside a 30-day activity chart. The page also surfaces the [issues](../signals/overview) affecting this user and the behaviours they triggered, so you can connect one user's complaints to known problems.
## Send user identifiers
Attach a stable user id when you capture a trace. You can also send a user email when it is useful for support workflows.
```ts theme={"theme":{"light":"github-light","dark":"github-dark"}}
import { capture } from "@latitude-data/telemetry"
await capture(
"support-agent-turn",
async () => {
return agent.run(userMessage)
},
{
userId: user.id,
userEmail: user.email,
},
)
```
```python theme={"theme":{"light":"github-light","dark":"github-dark"}}
from latitude_telemetry import capture
capture(
"support-agent-turn",
lambda: agent.run(user_message),
{
"user_id": user.id,
"user_email": user.email,
},
)
```
## The users dashboard
The dashboard opens with aggregate metrics for the selected time range — unique users, new users, the share of traces carrying a user id, and traces per user — above an activity histogram. Drag across the histogram to zoom into a narrower period.
Below, the table shows one row per user:
* **Seen at**: last and first activity within the selected period
* **Trend**: a per-user activity sparkline
* **Sessions**: distinct sessions in the period
* **Errors**: the rate and count of sessions with at least one errored trace
* **Cost**: per-user spend, with a column rollup you can cycle between SUM, AVG, and MED
Use the time range, column selector, and search controls to focus on a subset of users. Search matches user ids and emails, and every column with a sort icon is sortable.
## User detail
Open a user to see their lifetime profile: traces, sessions, errored sessions, cost, tokens, average trace duration, and active days, alongside a 30-day activity chart. The page also surfaces the [issues](../signals/overview) affecting this user and the behaviours they triggered, so you can connect one user's complaints to known problems.
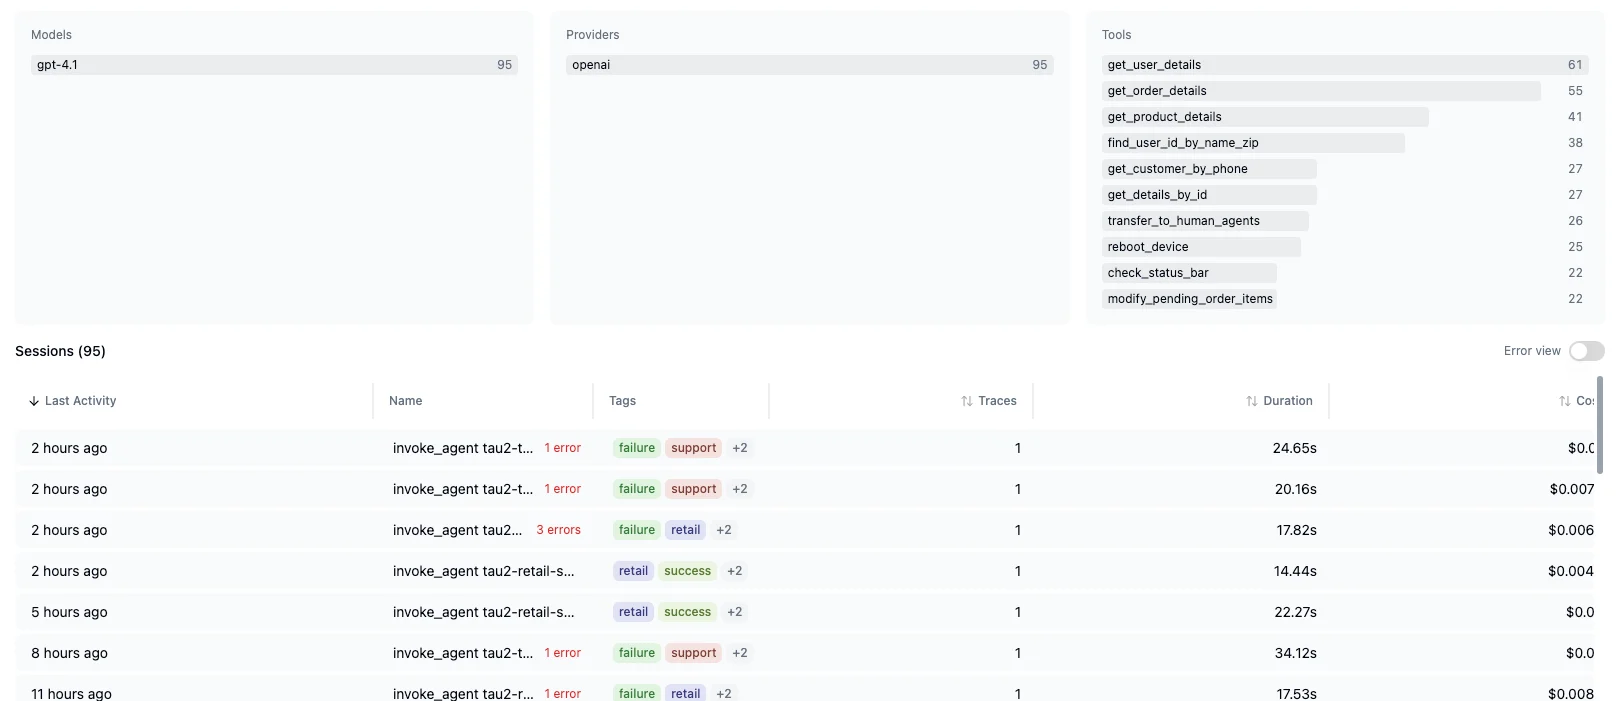
 Further down, usage breakdowns show which models, providers, and tools this user's traces relied on, followed by their sessions. Toggle the error view to focus on the sessions that failed.
 ## Related
* [User tracking](./features/user-tracking): How user ids are attached to traces
* [Sessions](./sessions): Group traces into conversations
* [Traces](./traces): Review individual interactions
## Related
* [User tracking](./features/user-tracking): How user ids are attached to traces
* [Sessions](./sessions): Group traces into conversations
* [Traces](./traces): Review individual interactions