> ## Documentation Index
> Fetch the complete documentation index at: https://docs.latitude.so/llms.txt
> Use this file to discover all available pages before exploring further.
# Traces
> Understand the trace model, lifecycle, and how to work with traces in Latitude
# Traces
A trace represents one complete interaction between a user and your agent. It's the primary unit that Latitude's reliability features operate on: evaluations, annotations, and issues all reference traces.
 ## What's in a Trace
A trace is composed of one or more **spans**: the individual operations your agent performed. A typical trace might include:
* An incoming user message
* One or more LLM calls
* Tool invocations (search, database queries, API calls)
* Retrieval operations
* The final agent response
Traces are defined by your telemetry client and sent to Latitude with their spans already grouped. Latitude computes aggregate metrics from those spans, giving you:
* **Root span name**: The top-level operation name
* **Overall status**: OK or error, derived from constituent spans
* **Total duration**: End-to-end timing
* **Aggregated tokens**: Total input and output tokens across all LLM calls
* **Aggregated cost**: Total cost across all provider calls
* **Span count**: How many individual operations were involved
* **Error count**: How many spans errored
* **Models and providers**: Which LLMs and providers were used
* **Tags and metadata**: Custom labels and structured metadata
## Trace completion
Latitude waits until a trace has finished before using it in downstream workflows. This keeps search, evaluations, flaggers, and signal discovery focused on complete interactions rather than partial agent runs.
Once a trace is complete, Latitude can:
* make it available in [Search](../search/overview)
* run matching [Evaluations](../evaluations/overview)
* apply enabled [Flaggers](../annotations/flaggers)
* connect resulting [Scores](../scores/overview) to [Issues](../signals/overview)
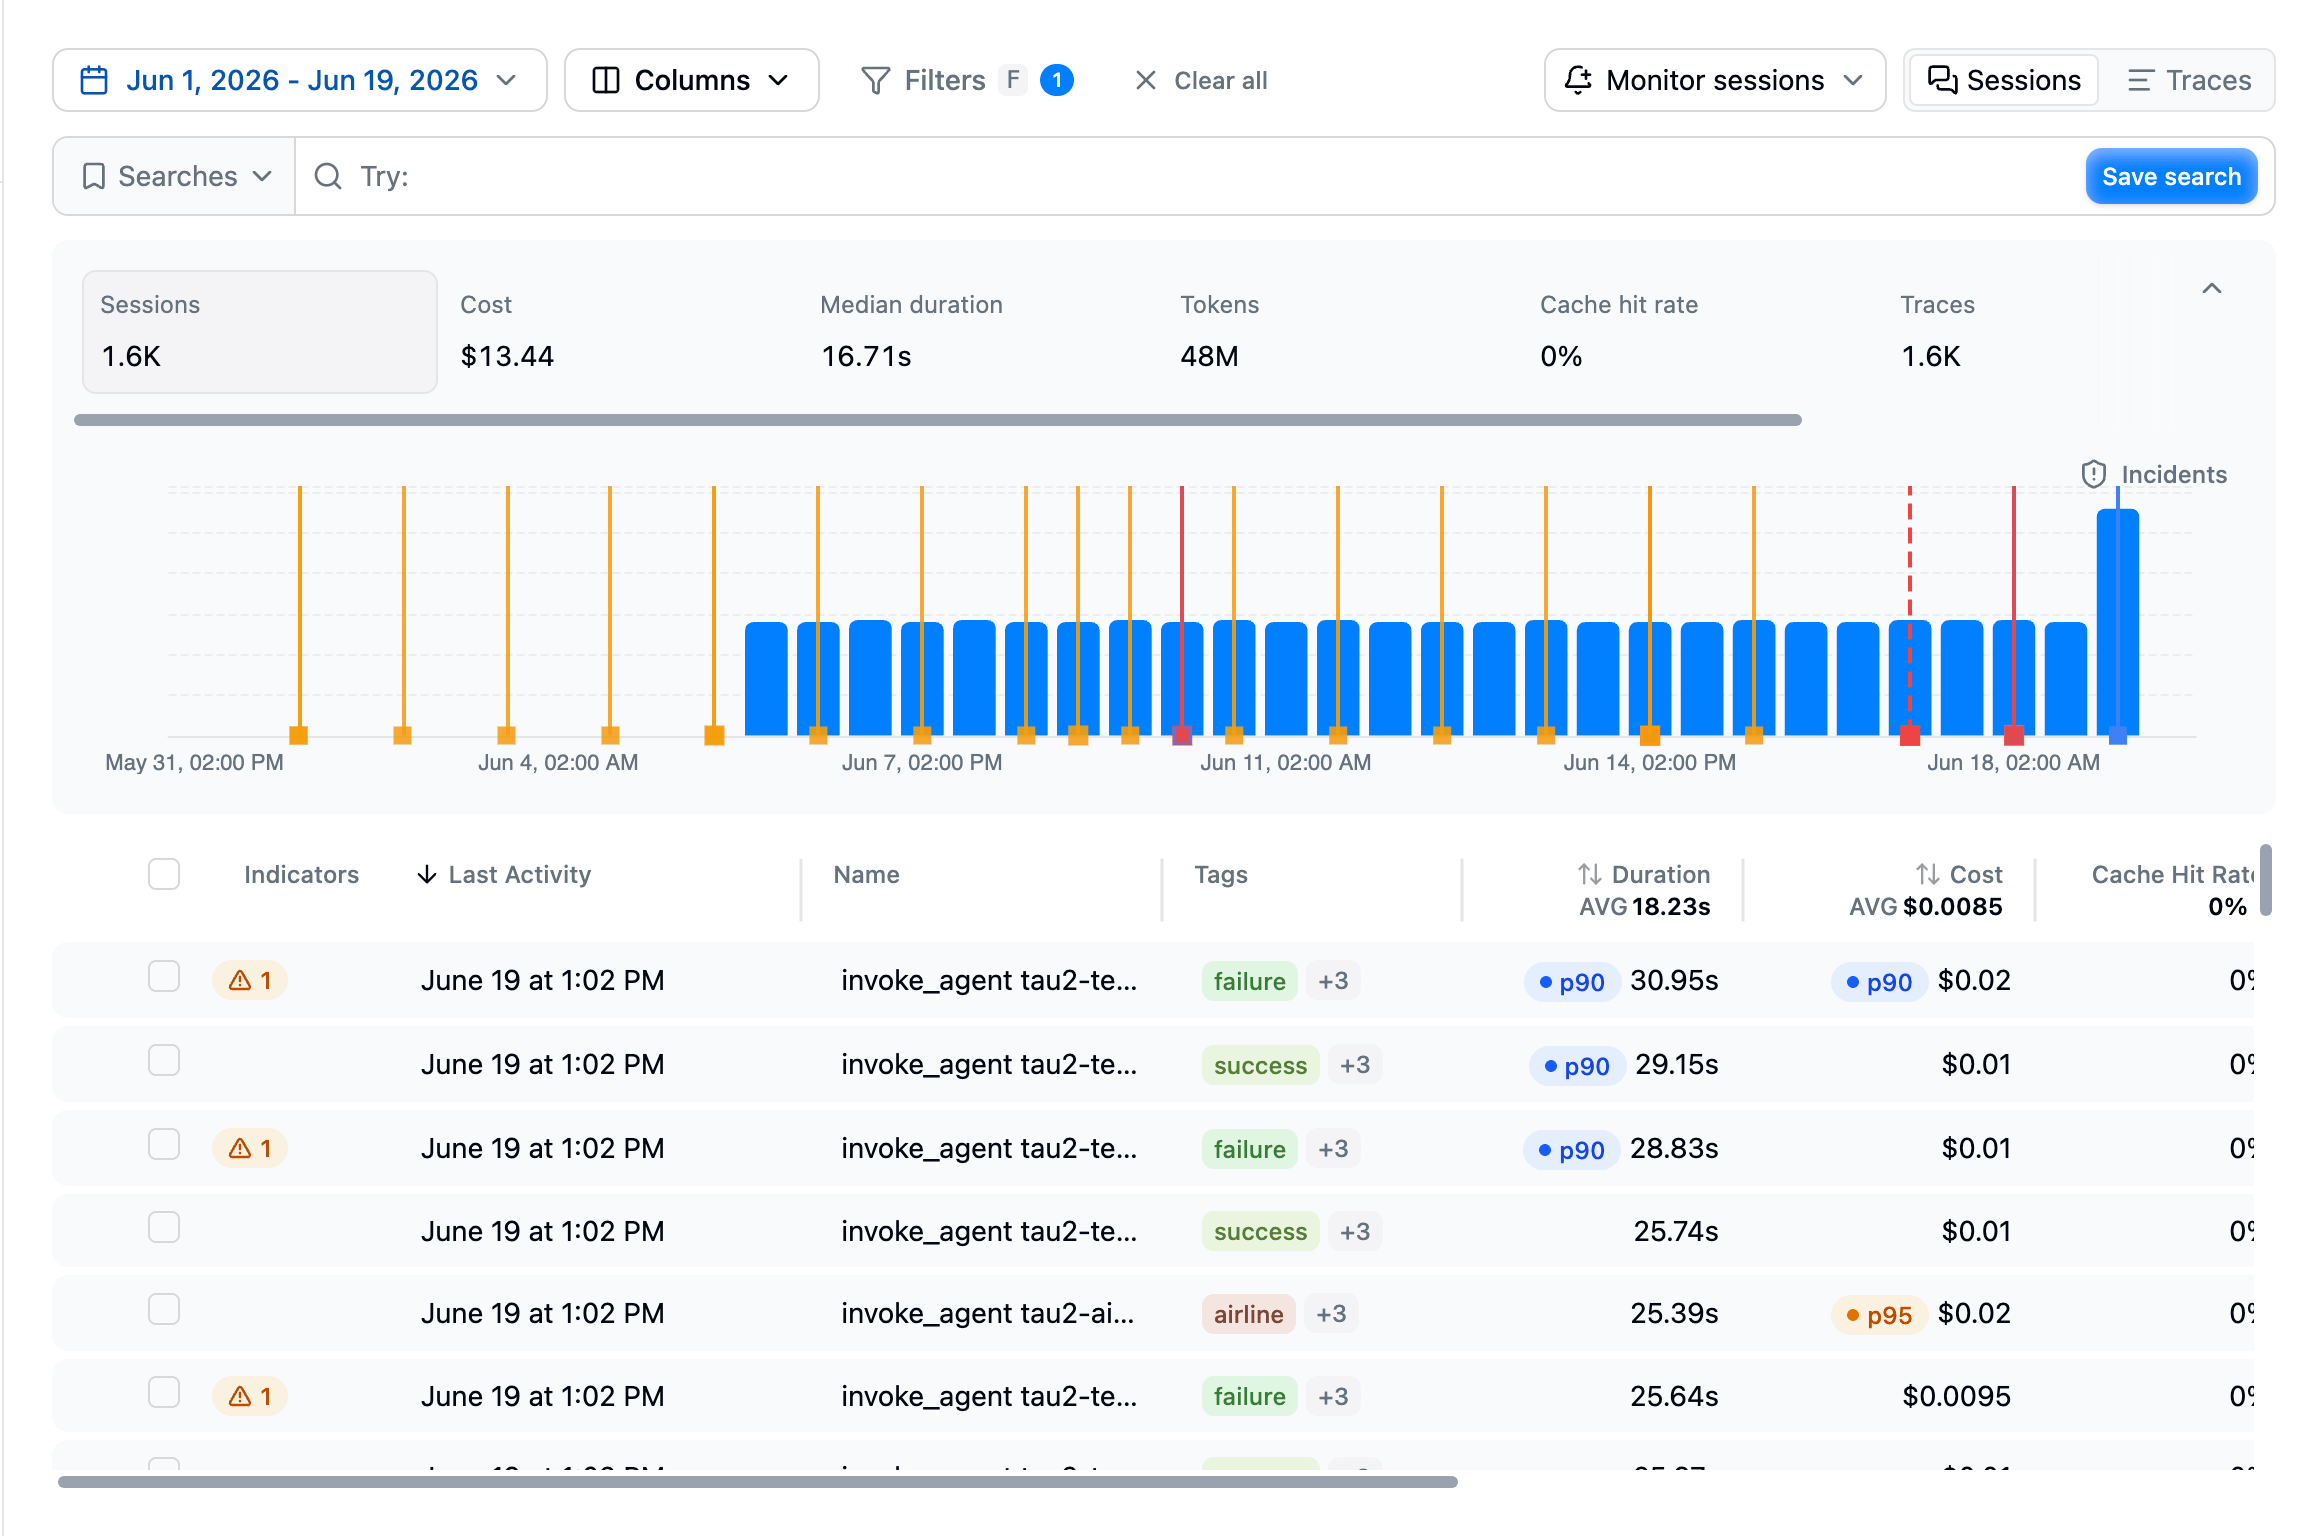
## Viewing Traces
The **Traces** page in your project shows a table of all traces, newest first. Each row displays key metadata at a glance: name, status, duration, cost, tokens, and timestamp.
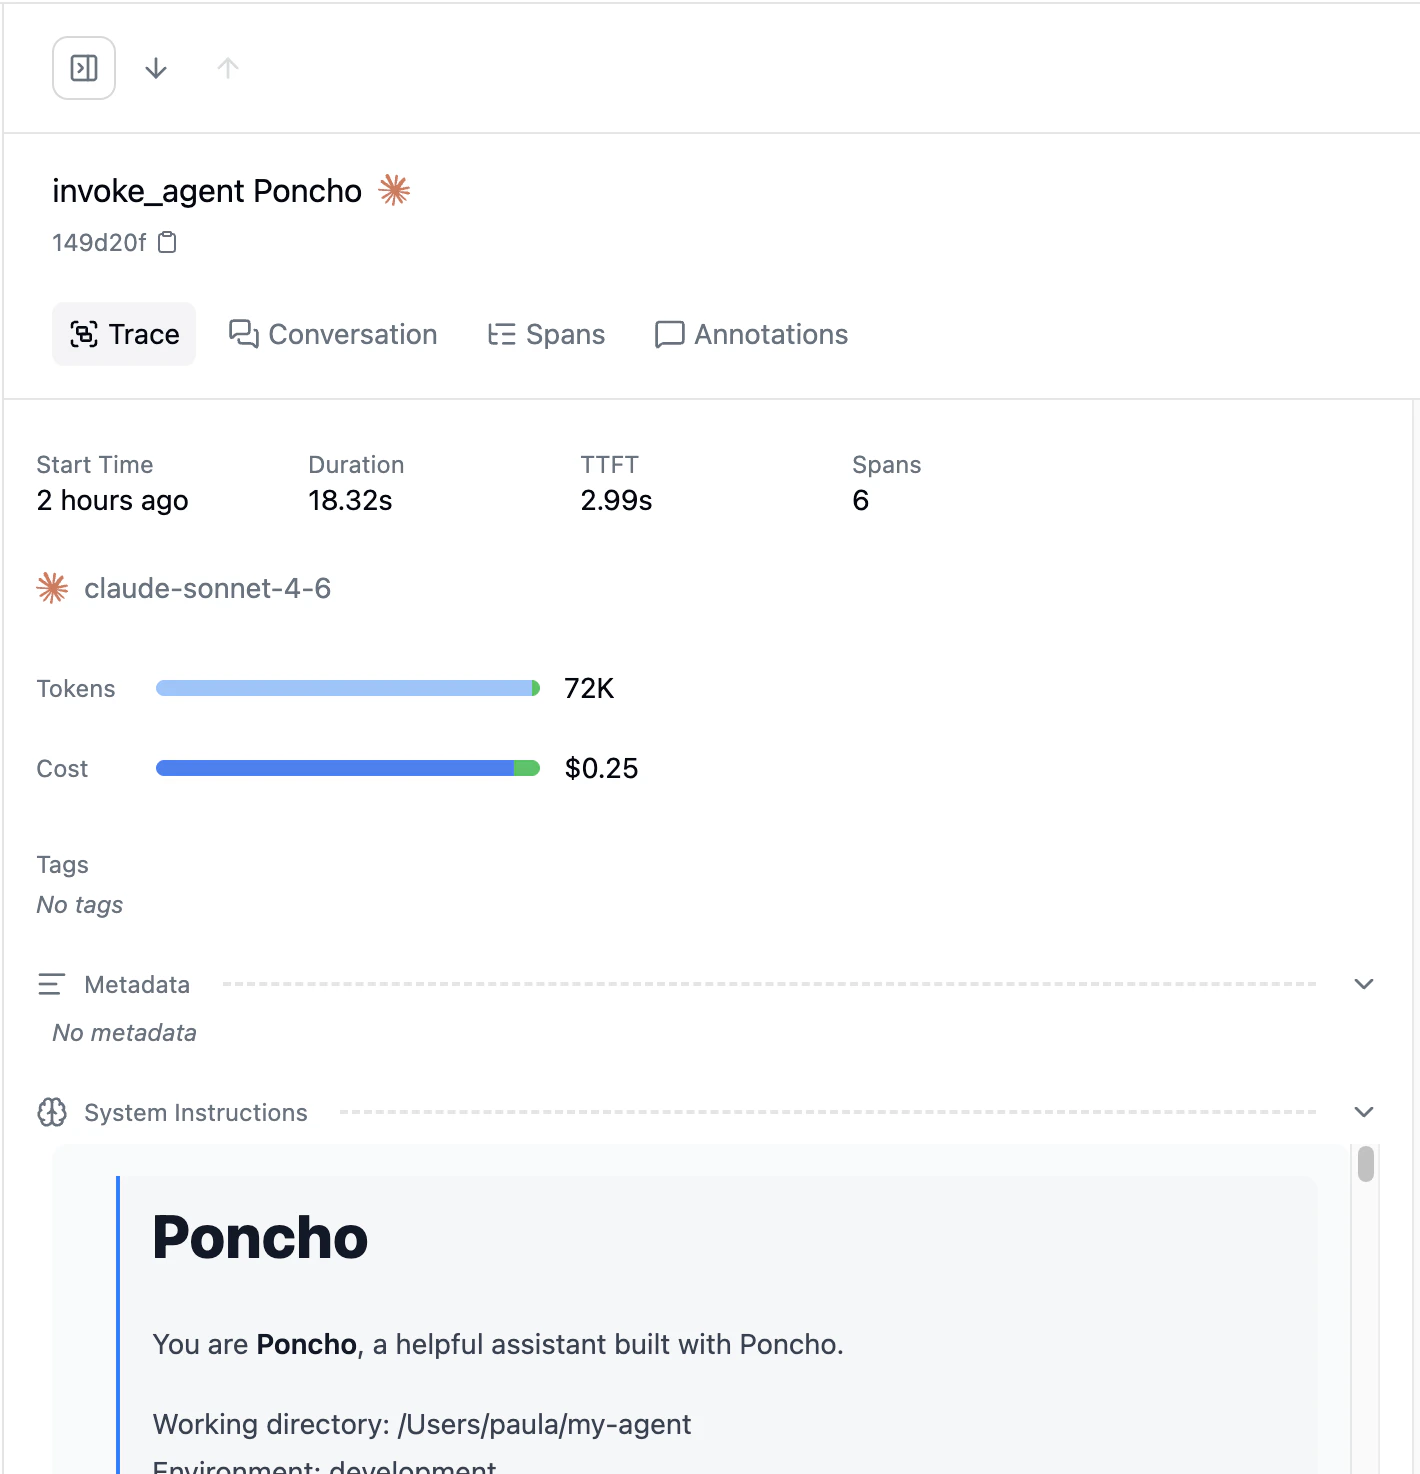
Click on a trace to open the detail view, which shows:
* **The full conversation**: All messages exchanged between user and agent
* **The span tree**: A hierarchical view of every operation your agent performed
* **Scores**: Any evaluation, annotation, or custom scores attached to this trace
* **Metadata**: Custom fields, timing details, and resource usage
## What's in a Trace
A trace is composed of one or more **spans**: the individual operations your agent performed. A typical trace might include:
* An incoming user message
* One or more LLM calls
* Tool invocations (search, database queries, API calls)
* Retrieval operations
* The final agent response
Traces are defined by your telemetry client and sent to Latitude with their spans already grouped. Latitude computes aggregate metrics from those spans, giving you:
* **Root span name**: The top-level operation name
* **Overall status**: OK or error, derived from constituent spans
* **Total duration**: End-to-end timing
* **Aggregated tokens**: Total input and output tokens across all LLM calls
* **Aggregated cost**: Total cost across all provider calls
* **Span count**: How many individual operations were involved
* **Error count**: How many spans errored
* **Models and providers**: Which LLMs and providers were used
* **Tags and metadata**: Custom labels and structured metadata
## Trace completion
Latitude waits until a trace has finished before using it in downstream workflows. This keeps search, evaluations, flaggers, and signal discovery focused on complete interactions rather than partial agent runs.
Once a trace is complete, Latitude can:
* make it available in [Search](../search/overview)
* run matching [Evaluations](../evaluations/overview)
* apply enabled [Flaggers](../annotations/flaggers)
* connect resulting [Scores](../scores/overview) to [Issues](../signals/overview)
## Viewing Traces
The **Traces** page in your project shows a table of all traces, newest first. Each row displays key metadata at a glance: name, status, duration, cost, tokens, and timestamp.
Click on a trace to open the detail view, which shows:
* **The full conversation**: All messages exchanged between user and agent
* **The span tree**: A hierarchical view of every operation your agent performed
* **Scores**: Any evaluation, annotation, or custom scores attached to this trace
* **Metadata**: Custom fields, timing details, and resource usage
 ## Searching and Filtering Traces
The project **Search** page lets you search trace conversations in three ways. You can combine them in one query:
* **Semantic search**: write normal text without quotes. Latitude searches by meaning and ranks matching traces first. Example: `customer wants a refund` can find traces where the user says "I need my money back" even if the exact words differ.
* **Literal match**: wrap text in double quotes. Latitude looks for that exact case-sensitive text in the searchable conversation. Example: `"handOffToHuman: true"` matches that exact string.
* **Phrase match**: wrap text in backticks. Latitude searches for those words next to each other and in order, while ignoring case and punctuation between them. Example: `` `human-annotation` `` can match `human-annotation`, `Human annotation`, or `"human": "annotation"`, but not `human something annotation`.
For example:
```txt theme={"theme":{"light":"github-light","dark":"github-dark"}}
refund "handOffToHuman: true" `human-annotation`
```
This finds traces that contain the literal text `handOffToHuman: true`, contain the adjacent phrase tokens `human` and `annotation`, and ranks the remaining matches by how semantically close they are to `refund`.
Click the **Filters** button in the toolbar to open the filter panel. You can combine any number of filters with search to narrow your trace view.
### Available Filters
Filter traces by their completion status. Select one or more:
* **OK**: Trace completed without errors
* **ERROR**: At least one span in the trace errored
* **UNSET**: Status was not reported
Filter by the root span name (the `path` you set in `capture()`). Type a name to match.
Filter traces belonging to a specific session. Useful for viewing the full history of a multi-turn conversation.
Filter traces generated by a specific simulation run.
Filter traces by end-user identifier, if your application passes one via telemetry metadata.
Filter by custom tags attached to traces. Search and select from the list of tags seen in your project.
Filter by the LLM model(s) used in the trace (e.g. `gpt-4o`, `claude-3.5-sonnet`). Search and select from models seen in your project.
Filter by the LLM provider(s) used (e.g. OpenAI, Anthropic, Azure). Search and select from providers seen in your project.
Filter by the service name reported by OpenTelemetry instrumentation.
Set a min/max range to filter traces by total duration.
Set a min/max range to filter by time to first token. This is useful for identifying slow-starting responses.
Set a min/max range to filter by estimated total cost. Useful for finding expensive traces.
Set a min/max range for the number of spans in a trace. Higher span counts typically indicate more complex agent operations.
Set a min/max range for the number of errored spans within a trace.
Set a min/max range for total input tokens across all LLM calls in the trace.
Set a min/max range for total output tokens across all LLM calls in the trace.
Filter by custom key-value metadata. Add one or more conditions in the form `key = value`. This matches against the structured metadata your application sends with its telemetry.
### Combining Filters
All active filters are combined with **AND** logic. Traces must match every active filter to appear. For example:
* **Status** = ERROR **AND** **Cost** > \$1: find expensive failures
* **Models** = gpt-4o **AND** **Duration** > 5s: find slow GPT-4o traces
* **Metadata** `environment` = `production` **AND** **Error Count** > 0: find production errors
## Traces and Sessions
When your application provides a `session_id` with its telemetry, Latitude groups related traces into sessions. You can filter traces by session ID to see the full conversation history, or switch to the Sessions tab on the Traces page for a session-focused view.
## Next Steps
* [Sessions](./sessions): Session-level conversations and aggregation
* [Search](../search/overview): Find traces by meaning, not just metadata
* [Scores](../scores/overview): How scores attach to traces
* [Annotations](../annotations/inline-annotations): Annotating directly from trace views
## Searching and Filtering Traces
The project **Search** page lets you search trace conversations in three ways. You can combine them in one query:
* **Semantic search**: write normal text without quotes. Latitude searches by meaning and ranks matching traces first. Example: `customer wants a refund` can find traces where the user says "I need my money back" even if the exact words differ.
* **Literal match**: wrap text in double quotes. Latitude looks for that exact case-sensitive text in the searchable conversation. Example: `"handOffToHuman: true"` matches that exact string.
* **Phrase match**: wrap text in backticks. Latitude searches for those words next to each other and in order, while ignoring case and punctuation between them. Example: `` `human-annotation` `` can match `human-annotation`, `Human annotation`, or `"human": "annotation"`, but not `human something annotation`.
For example:
```txt theme={"theme":{"light":"github-light","dark":"github-dark"}}
refund "handOffToHuman: true" `human-annotation`
```
This finds traces that contain the literal text `handOffToHuman: true`, contain the adjacent phrase tokens `human` and `annotation`, and ranks the remaining matches by how semantically close they are to `refund`.
Click the **Filters** button in the toolbar to open the filter panel. You can combine any number of filters with search to narrow your trace view.
### Available Filters
Filter traces by their completion status. Select one or more:
* **OK**: Trace completed without errors
* **ERROR**: At least one span in the trace errored
* **UNSET**: Status was not reported
Filter by the root span name (the `path` you set in `capture()`). Type a name to match.
Filter traces belonging to a specific session. Useful for viewing the full history of a multi-turn conversation.
Filter traces generated by a specific simulation run.
Filter traces by end-user identifier, if your application passes one via telemetry metadata.
Filter by custom tags attached to traces. Search and select from the list of tags seen in your project.
Filter by the LLM model(s) used in the trace (e.g. `gpt-4o`, `claude-3.5-sonnet`). Search and select from models seen in your project.
Filter by the LLM provider(s) used (e.g. OpenAI, Anthropic, Azure). Search and select from providers seen in your project.
Filter by the service name reported by OpenTelemetry instrumentation.
Set a min/max range to filter traces by total duration.
Set a min/max range to filter by time to first token. This is useful for identifying slow-starting responses.
Set a min/max range to filter by estimated total cost. Useful for finding expensive traces.
Set a min/max range for the number of spans in a trace. Higher span counts typically indicate more complex agent operations.
Set a min/max range for the number of errored spans within a trace.
Set a min/max range for total input tokens across all LLM calls in the trace.
Set a min/max range for total output tokens across all LLM calls in the trace.
Filter by custom key-value metadata. Add one or more conditions in the form `key = value`. This matches against the structured metadata your application sends with its telemetry.
### Combining Filters
All active filters are combined with **AND** logic. Traces must match every active filter to appear. For example:
* **Status** = ERROR **AND** **Cost** > \$1: find expensive failures
* **Models** = gpt-4o **AND** **Duration** > 5s: find slow GPT-4o traces
* **Metadata** `environment` = `production` **AND** **Error Count** > 0: find production errors
## Traces and Sessions
When your application provides a `session_id` with its telemetry, Latitude groups related traces into sessions. You can filter traces by session ID to see the full conversation history, or switch to the Sessions tab on the Traces page for a session-focused view.
## Next Steps
* [Sessions](./sessions): Session-level conversations and aggregation
* [Search](../search/overview): Find traces by meaning, not just metadata
* [Scores](../scores/overview): How scores attach to traces
* [Annotations](../annotations/inline-annotations): Annotating directly from trace views