> ## Documentation Index
> Fetch the complete documentation index at: https://docs.latitude.so/llms.txt
> Use this file to discover all available pages before exploring further.
# Sessions
> Group related traces into multi-turn conversations.
# Sessions
A session is an optional grouping of related traces into a multi-turn conversation. Traces always exist; sessions only exist when your application sends a session id with telemetry.
 ## How sessions work
All traces with the same session id are grouped together chronologically.
A session might look like:
1. **Trace 1**: User asks about an order status
2. **Trace 2**: User asks a follow-up question
3. **Trace 3**: User asks to change the order
Each turn is still its own trace with its own spans, scores, annotations, and metadata. The session ties those traces together so you can review the full conversation arc.
## Send a session id
Pass a session id through `capture()` at the request, conversation turn, or agent entrypoint.
```ts theme={"theme":{"light":"github-light","dark":"github-dark"}}
import { capture } from "@latitude-data/telemetry"
await capture(
"support-agent-turn",
async () => {
return agent.run(userMessage)
},
{
sessionId: conversation.id,
userId: user.id,
},
)
```
```python theme={"theme":{"light":"github-light","dark":"github-dark"}}
from latitude_telemetry import capture
capture(
"support-agent-turn",
lambda: agent.run(user_message),
{
"session_id": conversation.id,
"user_id": user.id,
},
)
```
Every trace captured with the same session id appears in the same session.
## Viewing sessions
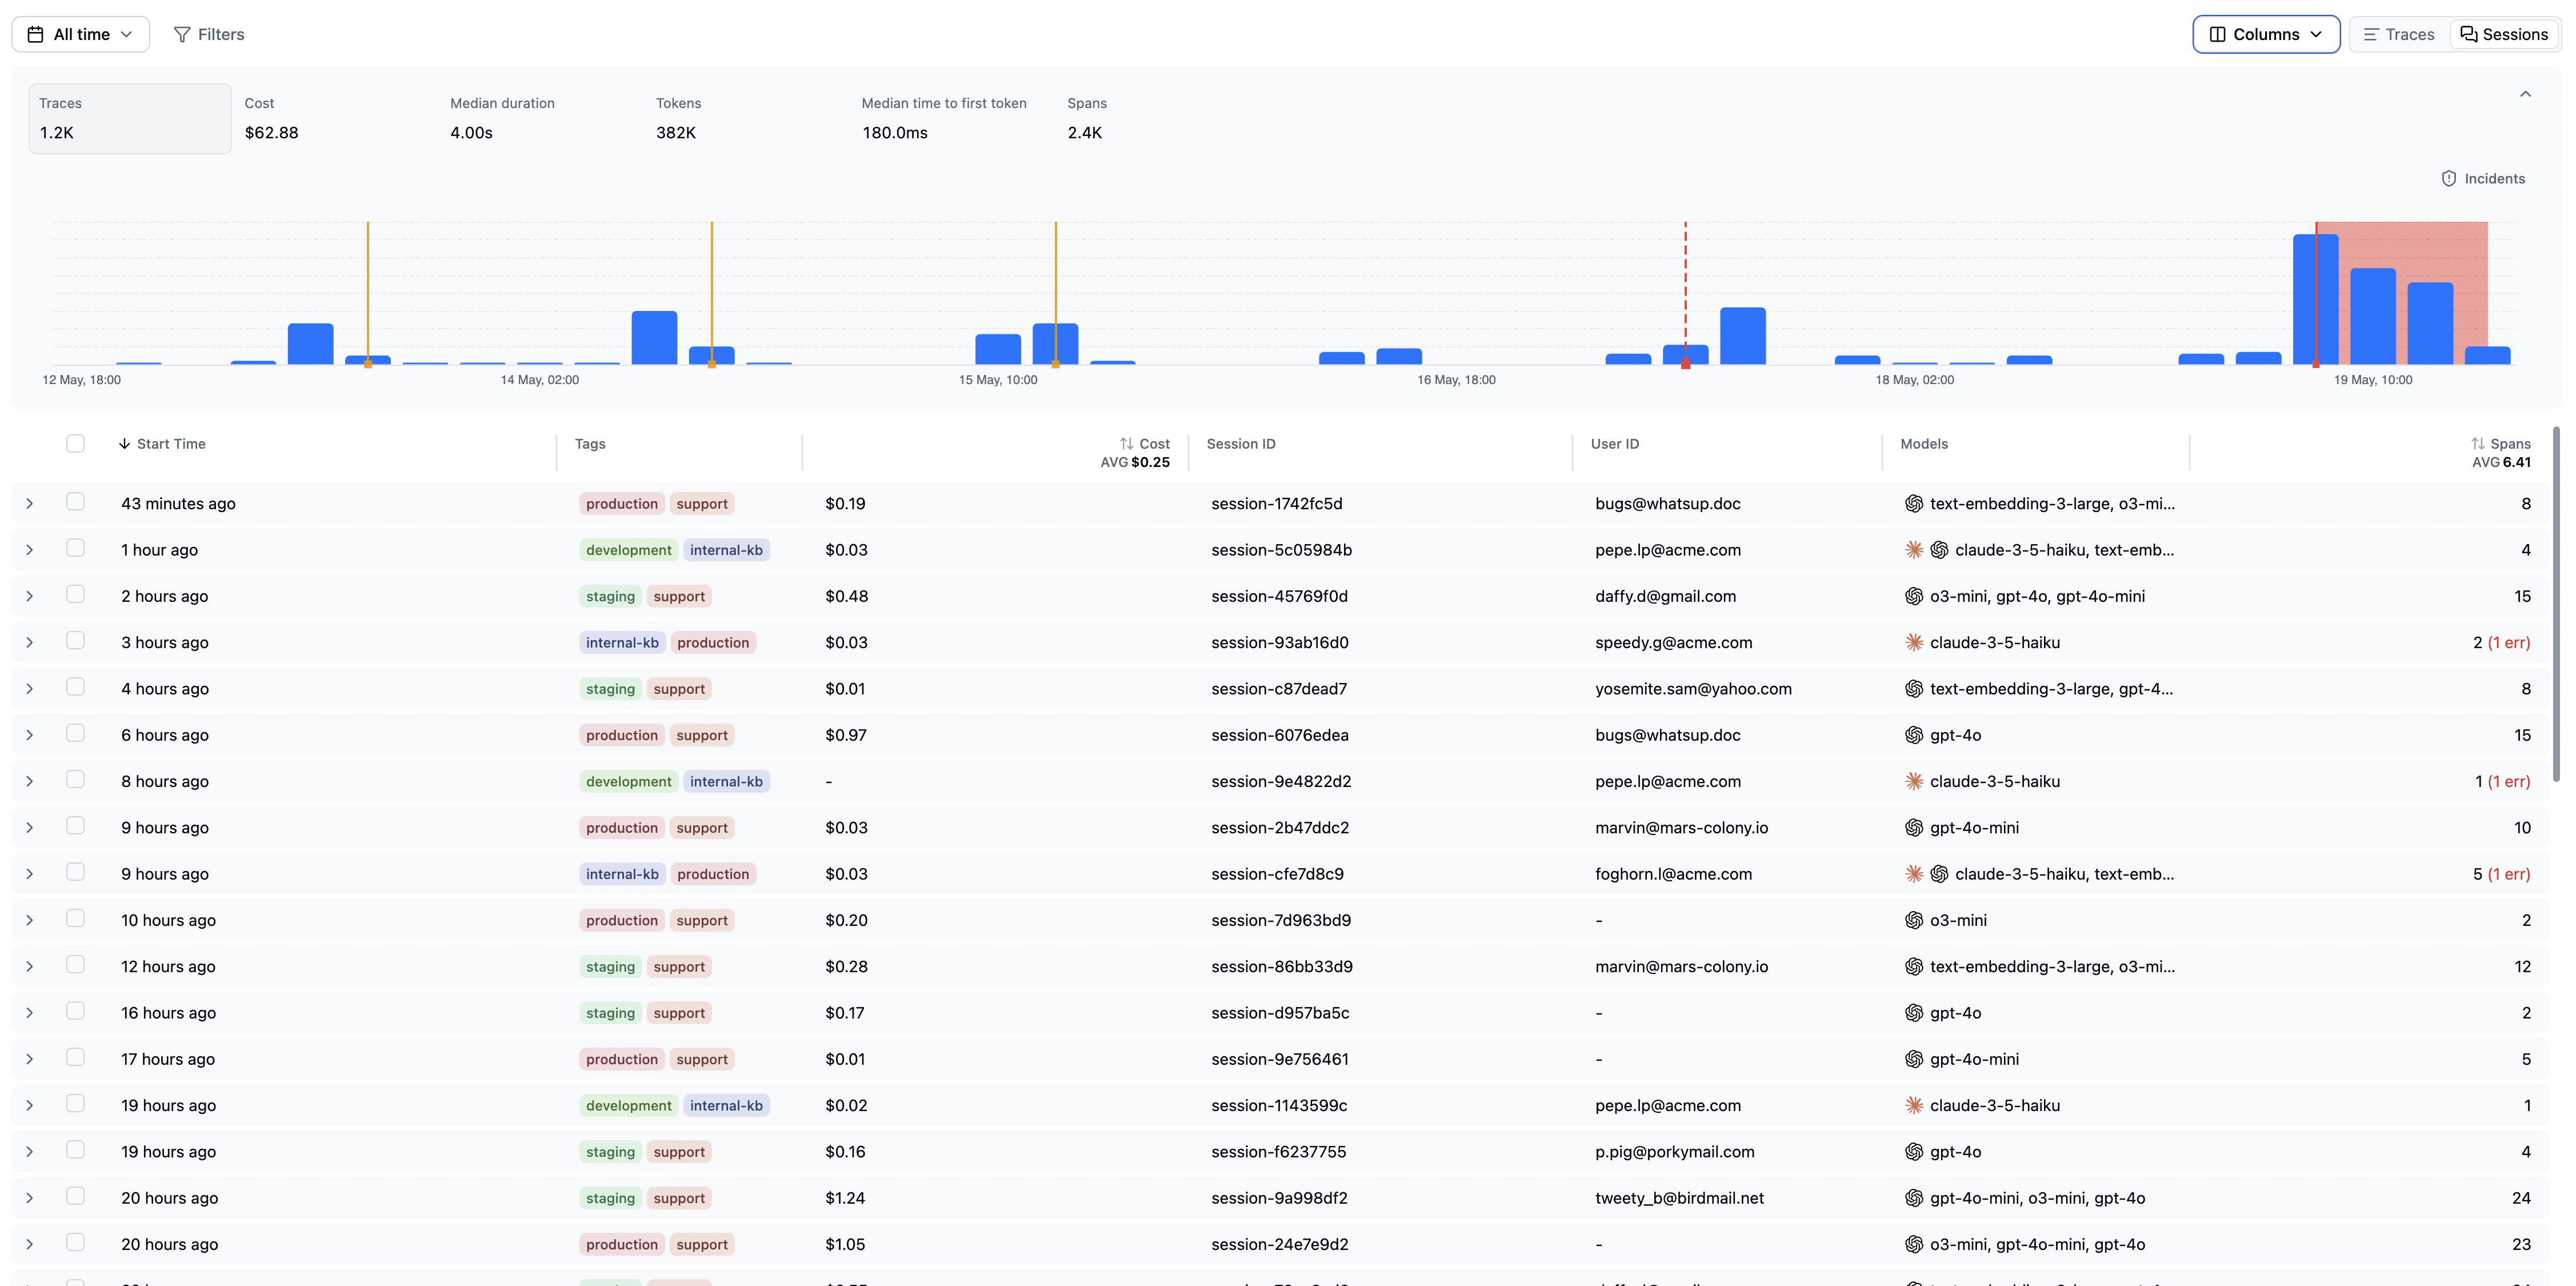
Switch between **Sessions** and **Traces** with the tab toggle at the top of the **Traces** page. Sessions is the default view.
The sessions view shows one row per session, with columns for:
* session name (the root span's name, falling back to the session id)
* last activity
* tags
* duration (active execution time)
* time to first token
* cost
* session id
* user id, when provided
* models used
* span count
* error and annotation indicators
Expand a row to see the traces inside the session, or click it to open a detail panel with the full conversation, the span tree, annotations, and any linked issues.
Each trace within a session keeps its own metrics, so you can identify which turn had high latency, high cost, errors, or unusual behaviour.
## Sessions in search and review
Sessions are an aggregation on top of traces. Search, annotations, scores, and issues still operate primarily on traces.
You can:
* filter traces by session id
* search within a specific session
* open traces from a session and annotate them
* use session context to understand failures that unfold across turns
## Related
* [Traces](./traces): The individual interactions that make up a session
* [User tracking](./features/user-tracking): Associate traces and sessions with users
* [Search](../search/overview): Find traces within session-scoped cohorts
* [Scores](../scores/overview): How scores attach to traces
## How sessions work
All traces with the same session id are grouped together chronologically.
A session might look like:
1. **Trace 1**: User asks about an order status
2. **Trace 2**: User asks a follow-up question
3. **Trace 3**: User asks to change the order
Each turn is still its own trace with its own spans, scores, annotations, and metadata. The session ties those traces together so you can review the full conversation arc.
## Send a session id
Pass a session id through `capture()` at the request, conversation turn, or agent entrypoint.
```ts theme={"theme":{"light":"github-light","dark":"github-dark"}}
import { capture } from "@latitude-data/telemetry"
await capture(
"support-agent-turn",
async () => {
return agent.run(userMessage)
},
{
sessionId: conversation.id,
userId: user.id,
},
)
```
```python theme={"theme":{"light":"github-light","dark":"github-dark"}}
from latitude_telemetry import capture
capture(
"support-agent-turn",
lambda: agent.run(user_message),
{
"session_id": conversation.id,
"user_id": user.id,
},
)
```
Every trace captured with the same session id appears in the same session.
## Viewing sessions
Switch between **Sessions** and **Traces** with the tab toggle at the top of the **Traces** page. Sessions is the default view.
The sessions view shows one row per session, with columns for:
* session name (the root span's name, falling back to the session id)
* last activity
* tags
* duration (active execution time)
* time to first token
* cost
* session id
* user id, when provided
* models used
* span count
* error and annotation indicators
Expand a row to see the traces inside the session, or click it to open a detail panel with the full conversation, the span tree, annotations, and any linked issues.
Each trace within a session keeps its own metrics, so you can identify which turn had high latency, high cost, errors, or unusual behaviour.
## Sessions in search and review
Sessions are an aggregation on top of traces. Search, annotations, scores, and issues still operate primarily on traces.
You can:
* filter traces by session id
* search within a specific session
* open traces from a session and annotate them
* use session context to understand failures that unfold across turns
## Related
* [Traces](./traces): The individual interactions that make up a session
* [User tracking](./features/user-tracking): Associate traces and sessions with users
* [Search](../search/overview): Find traces within session-scoped cohorts
* [Scores](../scores/overview): How scores attach to traces