> ## Documentation Index
> Fetch the complete documentation index at: https://docs.latitude.so/llms.txt
> Use this file to discover all available pages before exploring further.
# Percentile cohorts
> Compare trace duration, TTFT, cost, and token count against similar traces with the same tag set.
# Percentile cohorts
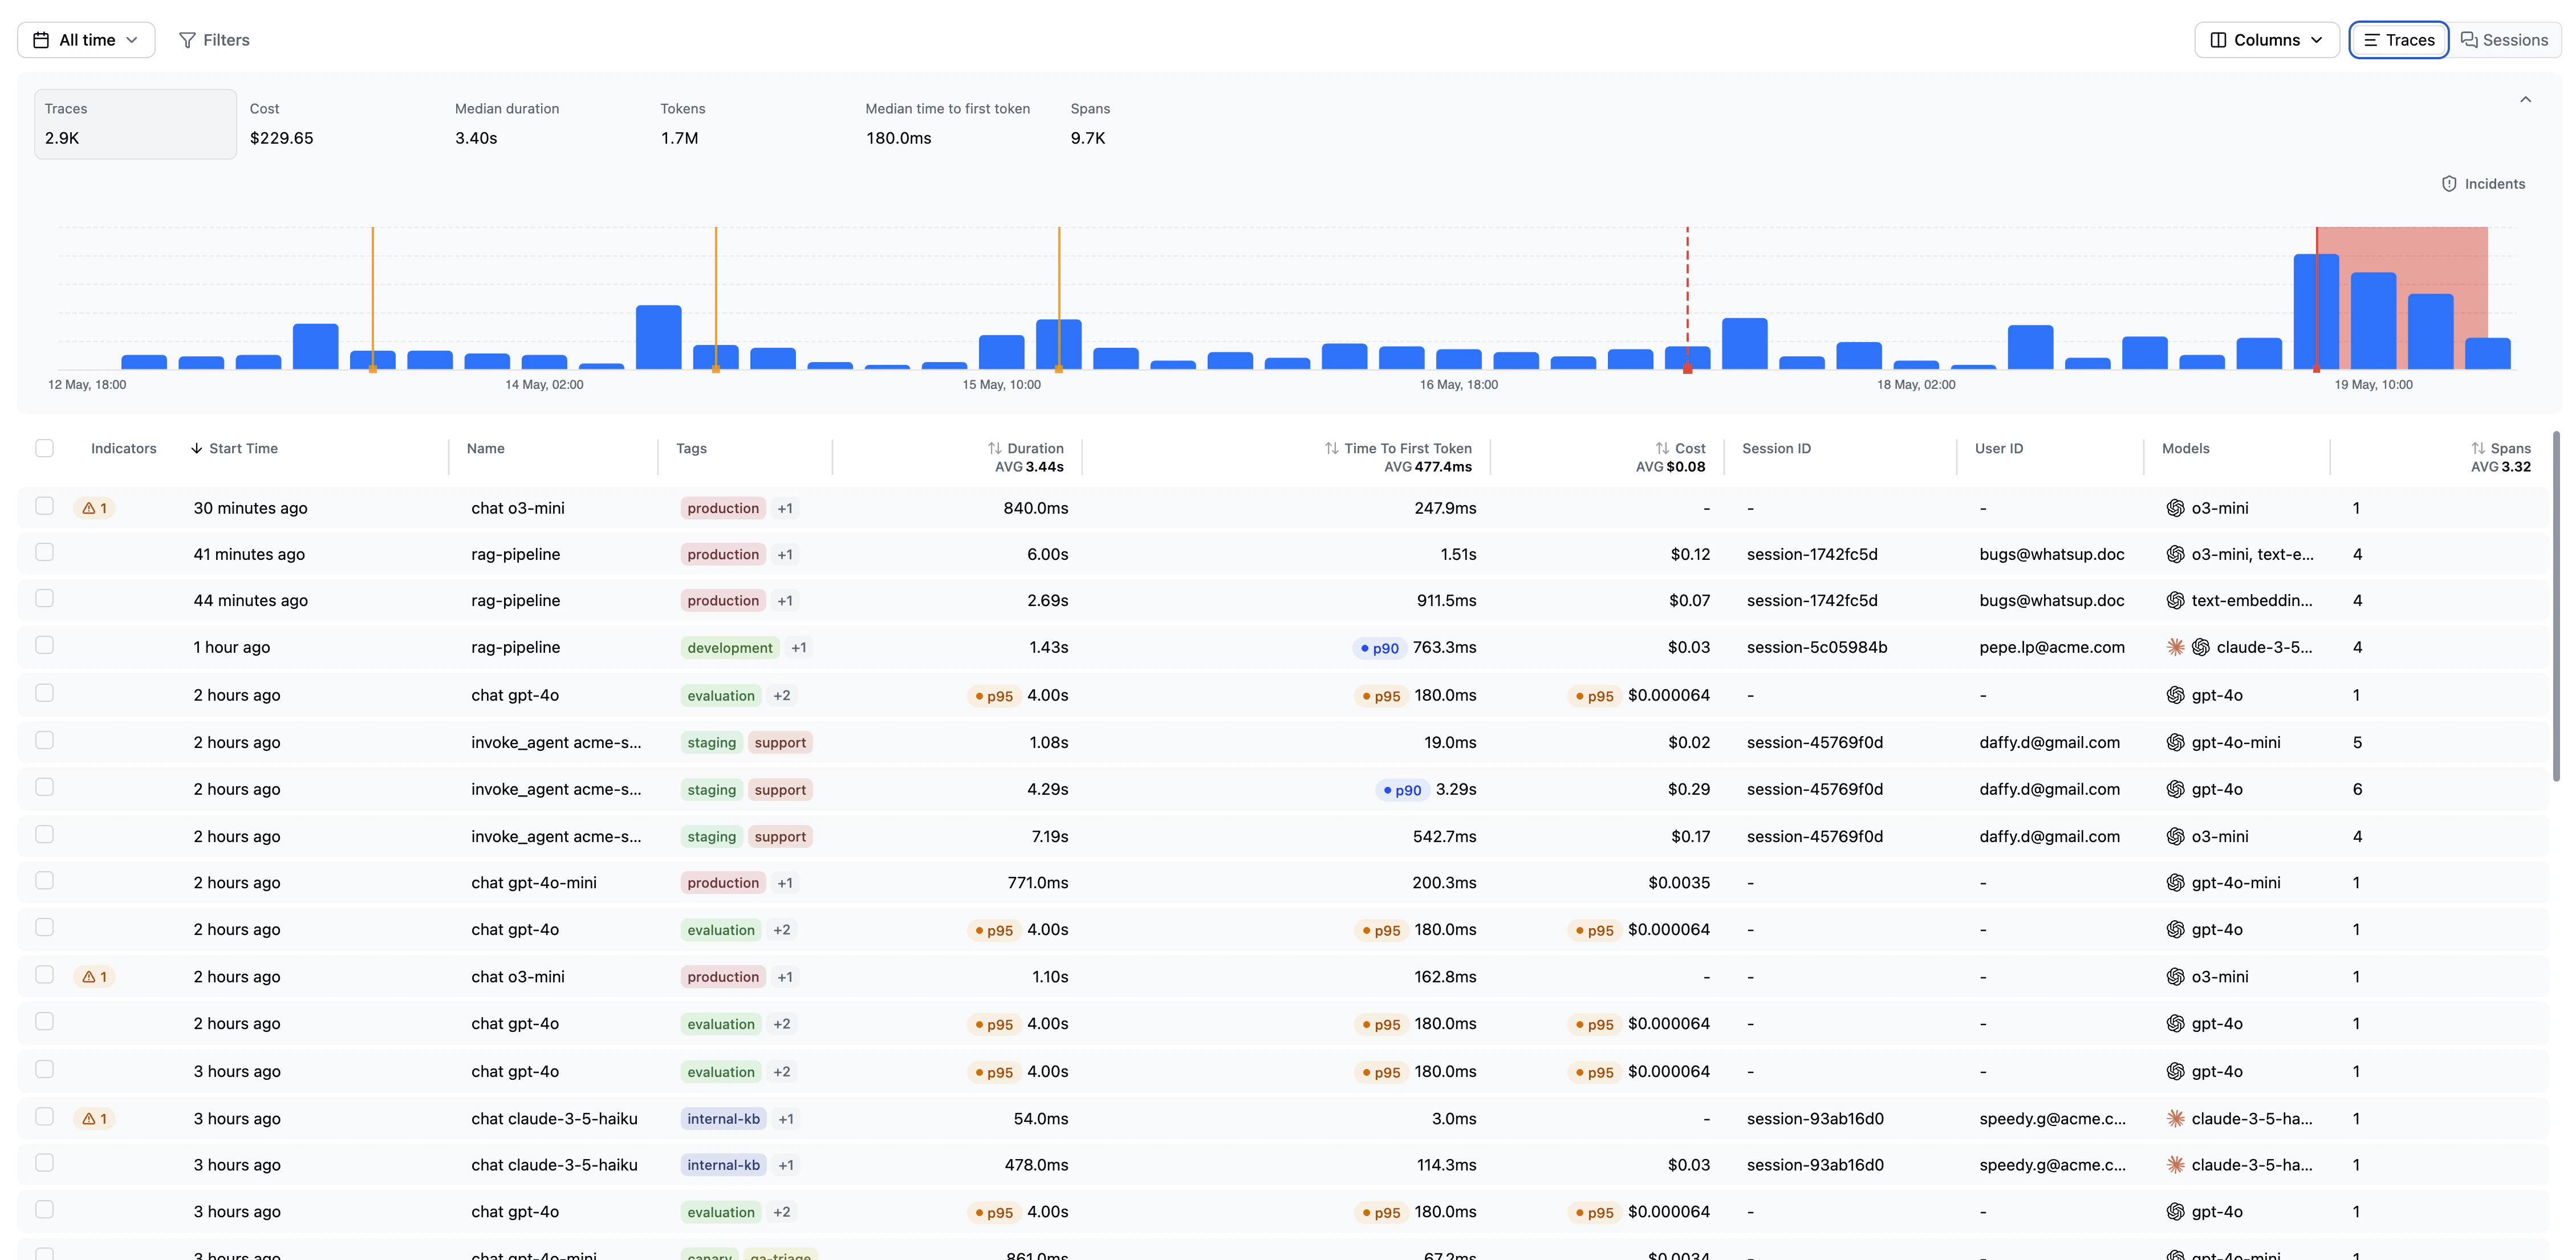
Latitude compares each trace with similar traces, so outliers are judged in context instead of against one global baseline.
A cohort is defined by the trace's exact tag combination. For example, traces tagged `production` and `support-agent` are compared with other traces that have the same tags. This keeps percentile badges meaningful across agents, environments, features, and workloads.
 ## Tracked dimensions
Latitude builds cohort baselines for:
* **Duration**: end-to-end trace duration
* **TTFT**: time to first token
* **Cost**: total estimated generation cost
* **Tokens**: total token count
These dimensions appear in trace tables, trace details, filters, and outlier badges.
## Percentile badges
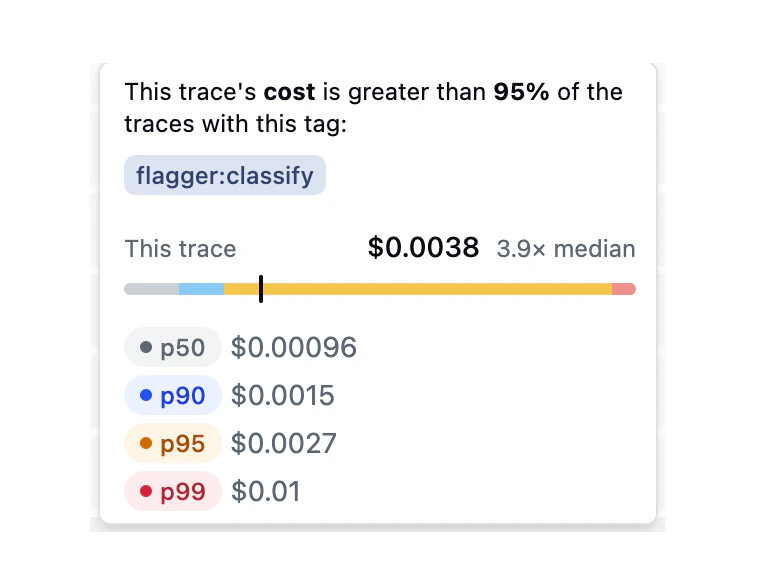
When a trace is unusually high for one of its cohort dimensions, Latitude can show a percentile badge such as `p90`, `p95`, or `p99`.
A `p95` duration badge means the trace took longer than at least 95% of traces in its cohort. A `p99` cost badge means it cost more than at least 99% of cohort traces.
The badge tooltip shows:
* the trace's value
* the cohort's baseline values
* the tags that define the cohort
* how far the trace is from the cohort median
## Tracked dimensions
Latitude builds cohort baselines for:
* **Duration**: end-to-end trace duration
* **TTFT**: time to first token
* **Cost**: total estimated generation cost
* **Tokens**: total token count
These dimensions appear in trace tables, trace details, filters, and outlier badges.
## Percentile badges
When a trace is unusually high for one of its cohort dimensions, Latitude can show a percentile badge such as `p90`, `p95`, or `p99`.
A `p95` duration badge means the trace took longer than at least 95% of traces in its cohort. A `p99` cost badge means it cost more than at least 99% of cohort traces.
The badge tooltip shows:
* the trace's value
* the cohort's baseline values
* the tags that define the cohort
* how far the trace is from the cohort median
 ## Tag-scoped cohorts
Because cohorts use exact tag combinations, the same raw value can be normal in one cohort and unusual in another.
For example:
* a long-running research agent may normally have higher duration
* a checkout support agent may normally have lower token usage
* staging traces may have different latency than production traces
* canary traffic may have different cost characteristics than stable traffic
Use tags consistently when you want Latitude to compare traces against the right baseline.
## Minimum baseline size
Percentile cohorts need enough historical traces before higher percentiles are meaningful. Until then, Latitude does not show higher-percentile outlier badges for that cohort.
As more traces arrive with the same tag combination, Latitude can compute stronger baselines and more precise comparisons.
## Using percentile cohorts
Use percentile cohorts to:
* spot slow traces relative to similar traffic
* find high-cost traces for a specific agent or environment
* identify token-heavy behaviours in one product area
* investigate high TTFT for one model/provider cohort
* combine outlier badges with search to discover behavioural causes
For example, filter to `p95` duration traces, then search for *agent loops between tools* to find looping behaviour behind slow traces.
## Related
* [Duration](./duration): Track trace and session duration
* [Token and cost tracking](./token-cost-tracking): Track usage and estimated cost
* [Tags](./tags): Define useful cohorts with consistent tags
* [Filters](../filters): Filter by percentile thresholds
* [Search](../../search/overview): Discover behaviours inside outlier cohorts
## Tag-scoped cohorts
Because cohorts use exact tag combinations, the same raw value can be normal in one cohort and unusual in another.
For example:
* a long-running research agent may normally have higher duration
* a checkout support agent may normally have lower token usage
* staging traces may have different latency than production traces
* canary traffic may have different cost characteristics than stable traffic
Use tags consistently when you want Latitude to compare traces against the right baseline.
## Minimum baseline size
Percentile cohorts need enough historical traces before higher percentiles are meaningful. Until then, Latitude does not show higher-percentile outlier badges for that cohort.
As more traces arrive with the same tag combination, Latitude can compute stronger baselines and more precise comparisons.
## Using percentile cohorts
Use percentile cohorts to:
* spot slow traces relative to similar traffic
* find high-cost traces for a specific agent or environment
* identify token-heavy behaviours in one product area
* investigate high TTFT for one model/provider cohort
* combine outlier badges with search to discover behavioural causes
For example, filter to `p95` duration traces, then search for *agent loops between tools* to find looping behaviour behind slow traces.
## Related
* [Duration](./duration): Track trace and session duration
* [Token and cost tracking](./token-cost-tracking): Track usage and estimated cost
* [Tags](./tags): Define useful cohorts with consistent tags
* [Filters](../filters): Filter by percentile thresholds
* [Search](../../search/overview): Discover behaviours inside outlier cohorts