> ## Documentation Index
> Fetch the complete documentation index at: https://docs.latitude.so/llms.txt
> Use this file to discover all available pages before exploring further.
# Sandbox
> An isolated, free environment to debug your agents with Latitude's traces UI from your dev and staging environments — without polluting production.
# Sandbox
A **sandbox** is an isolated environment where you can send and inspect traces while you build. Point your agent at a sandbox from your **dev or staging** environment and watch exactly what it did in Latitude's traces UI — without your development traffic ever touching your production dashboards, billing, or alerts.
A sandbox is deliberately **minimal and focused on trace-level debugging**: it ingests and shows your traces, and nothing more. It mirrors your organization's project layout but holds completely separate data — your development traces.
 ## Switching to a sandbox
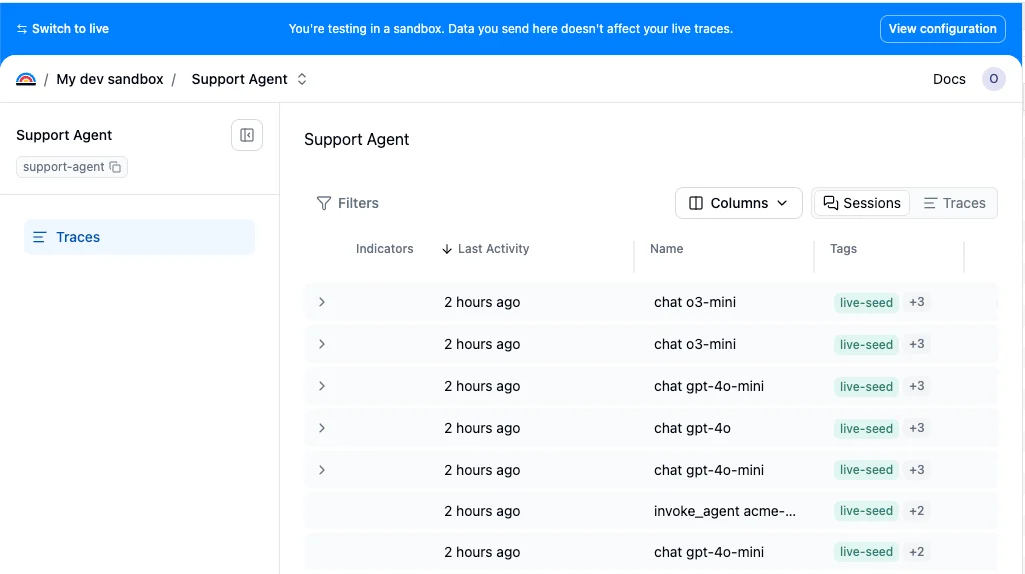
Your organization has a single sandbox. Flip the **Sandbox** toggle in the sidebar to switch into it — the first time, Latitude creates your sandbox and a sandbox copy of the project you're currently in; after that, the toggle just takes you there (and mirrors any new project you switch from). While you're in a sandbox, a blue banner across the top makes it unmistakable which environment you're in, and **Switch to live** takes you back.
## Switching to a sandbox
Your organization has a single sandbox. Flip the **Sandbox** toggle in the sidebar to switch into it — the first time, Latitude creates your sandbox and a sandbox copy of the project you're currently in; after that, the toggle just takes you there (and mirrors any new project you switch from). While you're in a sandbox, a blue banner across the top makes it unmistakable which environment you're in, and **Switch to live** takes you back.
 ## What's available in a sandbox
A sandbox is intentionally light. It gives you the full **trace-level debugging** experience — the Traces and Sessions list, grouping, sorting, filters, and per-trace detail (duration, tokens, spans, model, status).
The production monitoring layer is **not** available in a sandbox. The following features do **not** run on sandbox traces, by design:
* Semantic and saved searches
* Monitors and alerts
* Issue detection and clustering
* Evaluations, annotations, and flaggers
* Outbound notifications (email, Slack, webhooks) — a sandbox never reaches an external channel, so your experiments can't page teammates or hit customer alert channels
This keeps a sandbox free and fast, and means none of your development traffic triggers LLM work or costs.
## Using the same project identifiers as production
You instrument your code with the **same project names everywhere** — the API key decides where the traces land. Inside a sandbox you add the production projects you want to debug (which links them by stable id), or create sandbox-only projects for prototyping.
The only thing you change when developing against a sandbox is the **API key**. Sandbox keys are created from inside the sandbox and are prefixed **`lat_sandbox_`**, so they're easy to spot in code, logs, and review:
```bash theme={"theme":{"light":"github-light","dark":"github-dark"}}
# Production
LATITUDE_API_KEY=lat_...
# Sandbox — same project names, different key
LATITUDE_API_KEY=lat_sandbox_...
```
A sandbox key can only ever write to its sandbox, and a production key can only ever write to production — the key is the boundary. Sending a trace to a project the sandbox doesn't have is **rejected** (just as production rejects unknown projects), so there's never a silently created typo project.
## Differences from production
Sandbox keys have their own, lower ingest rate limit (**60 requests/min**, **64 MB/min**). Pointing real production traffic at a sandbox key fails loudly and immediately with a `429` — a clear signal to fix the key.
Sandbox traces are short-lived — spans are retained for **7 days** and then age out. A sandbox is for active debugging, not long-term storage.
Sandbox usage is **completely free**. Sandbox traces are never metered or charged and never touch your credit balance. Abuse is bounded by the rate limit and a per-period span quota instead.
Sandbox ingestion is bounded by a per-period **span quota** that scales with your plan: **100,000 spans** on Free, **1,000,000 spans** on Pro, and unlimited on Enterprise.
## Sleep and reactivation
A sandbox is put to **sleep** (archived) after **7 days of inactivity**. Sleeping sandboxes hold no live capacity.
Sending traces to a sleeping sandbox is **rejected** with a `403` (mirroring how an out-of-credits production org behaves) — nothing is silently accepted, and the sandbox isn't silently revived. To wake it back up, open the sandbox and press **Activate** in the banner (which turns gray while the sandbox is asleep) to resume ingestion.
## Related
* [Environments](../observability/features/environments): Separate dev, staging, and production traces with tags or metadata
* [Start tracing](../telemetry/start-tracing): Instrument your agent and send traces to Latitude
* [Traces](../observability/traces): The traces UI you use inside a sandbox
## What's available in a sandbox
A sandbox is intentionally light. It gives you the full **trace-level debugging** experience — the Traces and Sessions list, grouping, sorting, filters, and per-trace detail (duration, tokens, spans, model, status).
The production monitoring layer is **not** available in a sandbox. The following features do **not** run on sandbox traces, by design:
* Semantic and saved searches
* Monitors and alerts
* Issue detection and clustering
* Evaluations, annotations, and flaggers
* Outbound notifications (email, Slack, webhooks) — a sandbox never reaches an external channel, so your experiments can't page teammates or hit customer alert channels
This keeps a sandbox free and fast, and means none of your development traffic triggers LLM work or costs.
## Using the same project identifiers as production
You instrument your code with the **same project names everywhere** — the API key decides where the traces land. Inside a sandbox you add the production projects you want to debug (which links them by stable id), or create sandbox-only projects for prototyping.
The only thing you change when developing against a sandbox is the **API key**. Sandbox keys are created from inside the sandbox and are prefixed **`lat_sandbox_`**, so they're easy to spot in code, logs, and review:
```bash theme={"theme":{"light":"github-light","dark":"github-dark"}}
# Production
LATITUDE_API_KEY=lat_...
# Sandbox — same project names, different key
LATITUDE_API_KEY=lat_sandbox_...
```
A sandbox key can only ever write to its sandbox, and a production key can only ever write to production — the key is the boundary. Sending a trace to a project the sandbox doesn't have is **rejected** (just as production rejects unknown projects), so there's never a silently created typo project.
## Differences from production
Sandbox keys have their own, lower ingest rate limit (**60 requests/min**, **64 MB/min**). Pointing real production traffic at a sandbox key fails loudly and immediately with a `429` — a clear signal to fix the key.
Sandbox traces are short-lived — spans are retained for **7 days** and then age out. A sandbox is for active debugging, not long-term storage.
Sandbox usage is **completely free**. Sandbox traces are never metered or charged and never touch your credit balance. Abuse is bounded by the rate limit and a per-period span quota instead.
Sandbox ingestion is bounded by a per-period **span quota** that scales with your plan: **100,000 spans** on Free, **1,000,000 spans** on Pro, and unlimited on Enterprise.
## Sleep and reactivation
A sandbox is put to **sleep** (archived) after **7 days of inactivity**. Sleeping sandboxes hold no live capacity.
Sending traces to a sleeping sandbox is **rejected** with a `403` (mirroring how an out-of-credits production org behaves) — nothing is silently accepted, and the sandbox isn't silently revived. To wake it back up, open the sandbox and press **Activate** in the banner (which turns gray while the sandbox is asleep) to resume ingestion.
## Related
* [Environments](../observability/features/environments): Separate dev, staging, and production traces with tags or metadata
* [Start tracing](../telemetry/start-tracing): Instrument your agent and send traces to Latitude
* [Traces](../observability/traces): The traces UI you use inside a sandbox