> ## Documentation Index
> Fetch the complete documentation index at: https://docs.latitude.so/llms.txt
> Use this file to discover all available pages before exploring further.
# Self-Healing Agents
> Close the loop from detected production failure to reviewed pull request by dispatching your coding agent with the evidence attached.
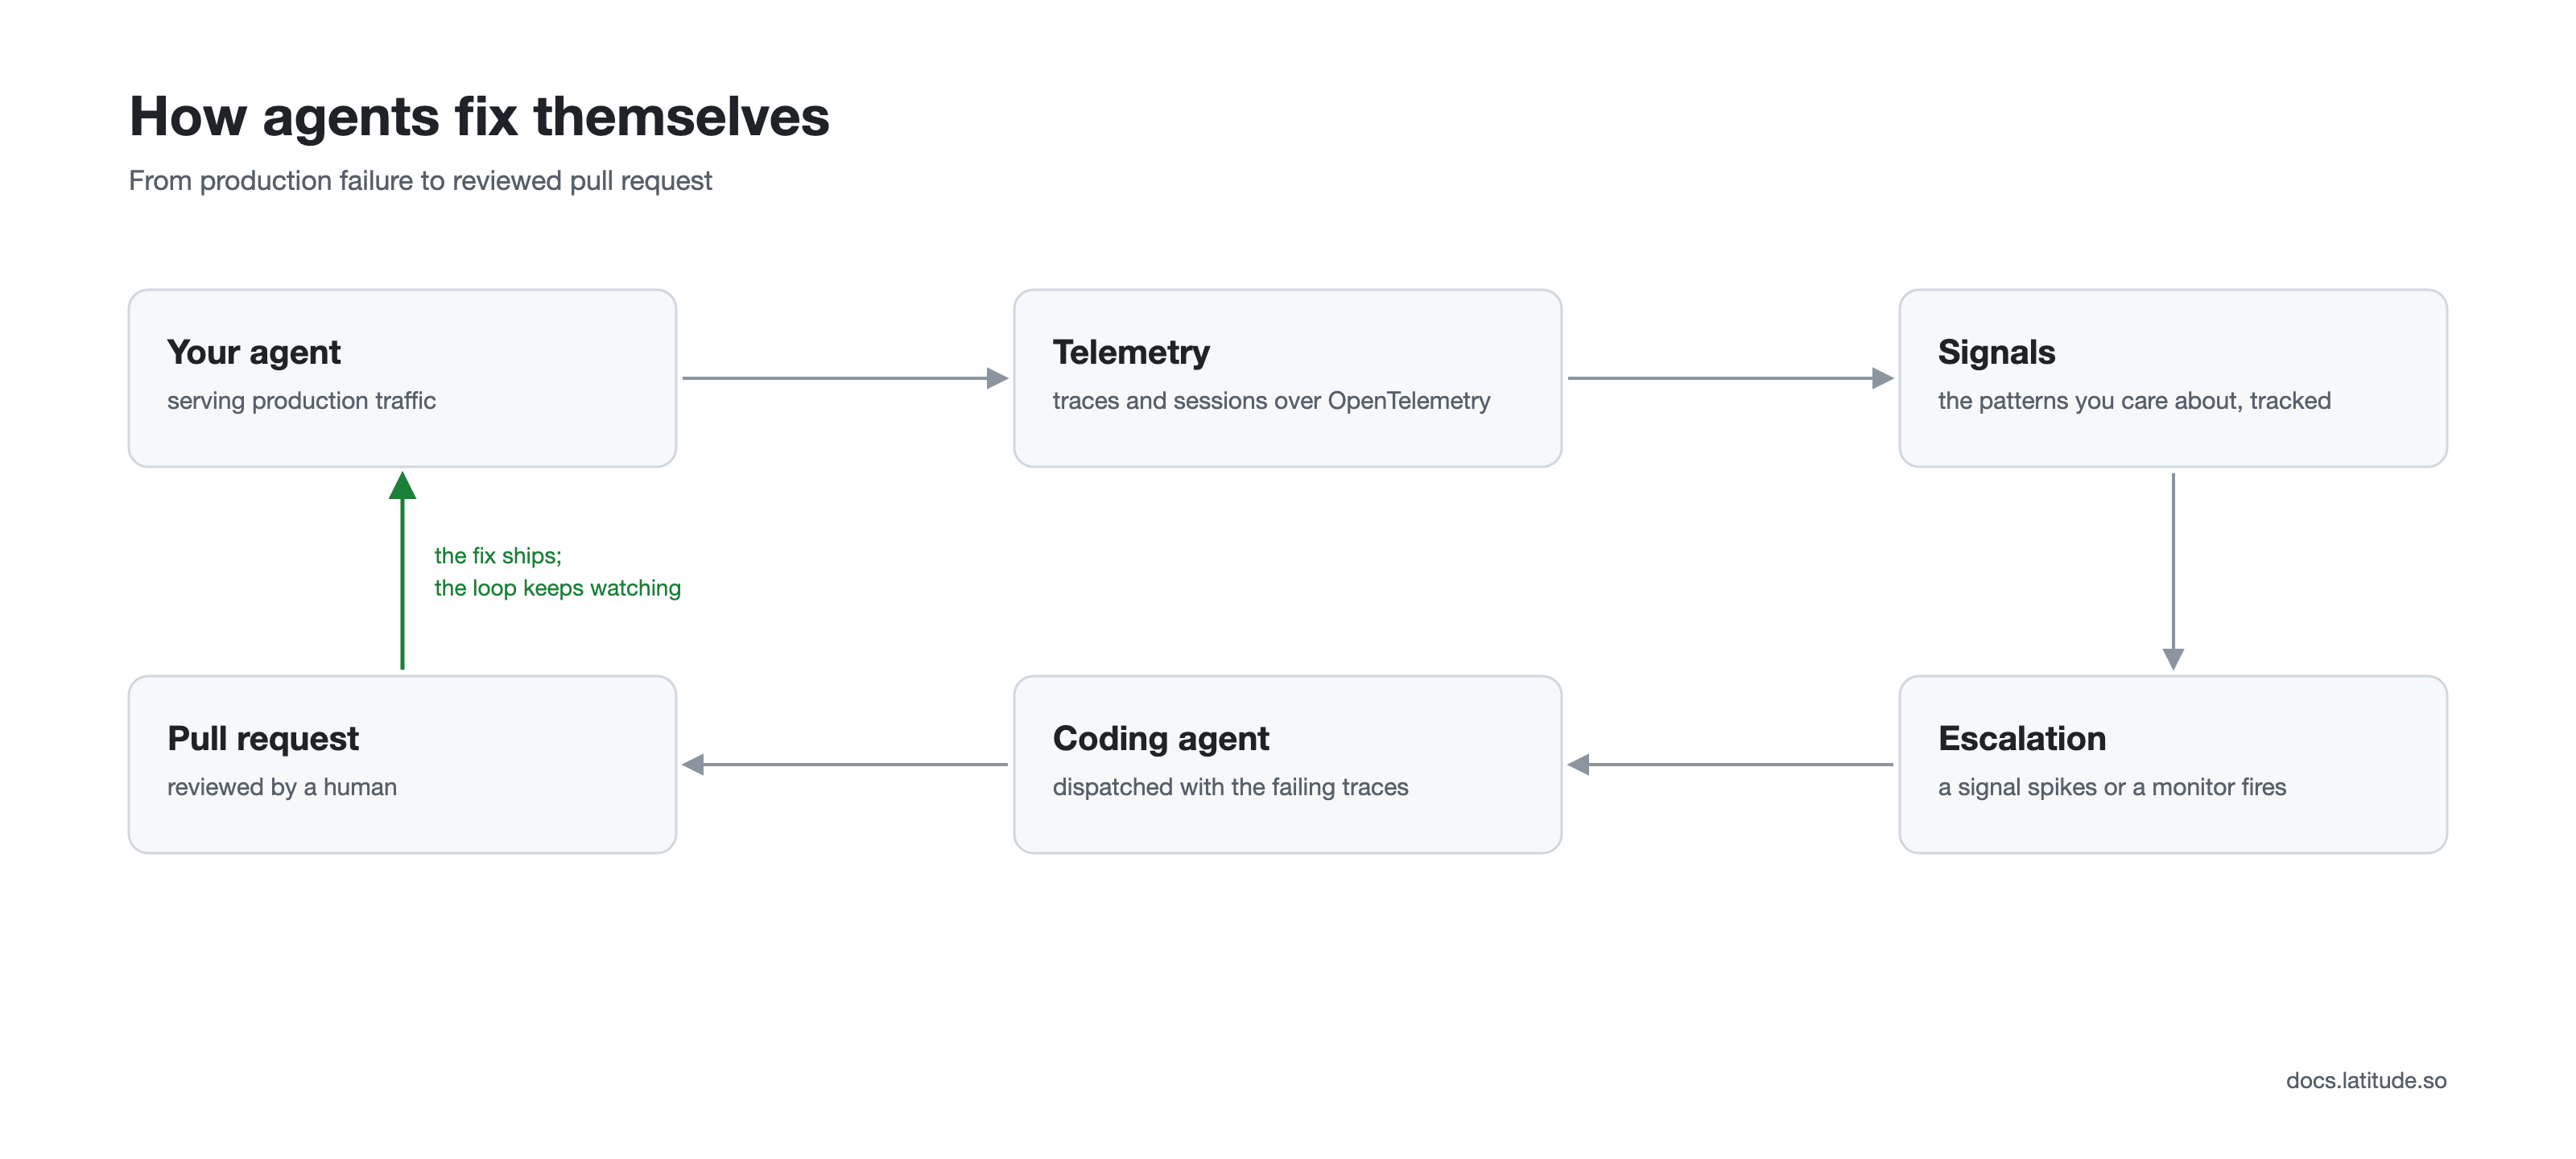
A self-healing agent is one whose production failures reach a coding agent automatically, with the evidence attached, so remediation starts from the detection instead of from a person relaying context. Latitude closes that loop end to end: traffic is observed, recurring patterns become tracked [signals](../signals/overview), escalations dispatch your coding agent, and the fix lands as a pull request that a person reviews, backed by a regression test in your CI.
 ## How the loop closes
Connect [telemetry](../telemetry/start-tracing) so every interaction arrives as a trace and multi-turn conversations group into [sessions](../observability/sessions). Find failures with [Search](../search/overview) when you can describe them, or let [Behaviours](../search/behaviours) surface the topics and trends you would not think to look for. [Annotations](../annotations/overview) and [flaggers](../annotations/flaggers) record what you find, and Latitude groups those into named, tracked [signals](../signals/overview).
Give a signal an [evaluation](../evaluations/overview), a script that can combine code rules, semantic similarity, and LLM judgment, and live traffic is scored as it arrives. The evaluation's [trigger](../evaluations/triggers) controls how much: generated evaluations start at a 10 percent sample, so raise the sampling and adjust the filters if the signal needs full coverage. Evaluations generated from your annotations carry an [alignment record](../evaluations/alignment), so how often the script agrees with a human reviewer is a measured number.
A signal escalates when its recent occurrences clear its own weekly rhythm, and [monitors](../monitors/overview) extend the same mechanism to saved searches and raw traffic metrics such as cost, latency, or cache hit rate. Either one opens an incident.
With [agent dispatch](../agent-dispatch/overview) configured, an escalating signal or an open incident wakes your coding agent with a prompt, a deep link, and sample failing traces. Latitude is the trigger and the context provider, not the agent runtime: the dispatched agent runs in your environment, with your credentials, against your repository. Direct integrations exist for [Claude Code](../agent-dispatch/claude-code), [Cursor](../agent-dispatch/cursor), and [Linear](../agent-dispatch/linear), with [webhooks](../agent-dispatch/webhooks) for everything else.
The dispatched agent investigates through the [MCP server](./mcp), reading the signal, slicing occurrences, and reading the failing conversations, then opens a pull request. Turn the failing traces behind the signal into a [dataset](../datasets/overview) and add a [regression test](../test-and-fix/regression-testing) that replays it in CI, so the fix has to pass before it merges and every later prompt change is checked against the same failure.
## Where humans stay
Two points of the loop are human by design. Annotations are the ground truth that evaluations are aligned against, and a person reviews every pull request before it merges. Everything between those points, finding examples, reconstructing context, and carrying trace ids between tools, is what the loop automates.
## Set it up
1. [Start tracing](../telemetry/start-tracing) one production agent.
2. Annotate a handful of real failures, or let [flaggers](../annotations/flaggers) do it.
3. Generate an [evaluation](../evaluations/overview) for the signal that matters most.
4. Add a [monitor](../monitors/overview) for any metric you cannot afford to miss.
5. Configure [agent dispatch](../agent-dispatch/overview) under **Settings → Integrations**.
Your coding agent can drive the whole workspace through the MCP server:
```bash theme={"theme":{"light":"github-light","dark":"github-dark"}}
claude mcp add --transport http latitude https://api.latitude.so/v1/mcp
```
For other coding agents, see the [MCP server docs](./mcp).
## How the loop closes
Connect [telemetry](../telemetry/start-tracing) so every interaction arrives as a trace and multi-turn conversations group into [sessions](../observability/sessions). Find failures with [Search](../search/overview) when you can describe them, or let [Behaviours](../search/behaviours) surface the topics and trends you would not think to look for. [Annotations](../annotations/overview) and [flaggers](../annotations/flaggers) record what you find, and Latitude groups those into named, tracked [signals](../signals/overview).
Give a signal an [evaluation](../evaluations/overview), a script that can combine code rules, semantic similarity, and LLM judgment, and live traffic is scored as it arrives. The evaluation's [trigger](../evaluations/triggers) controls how much: generated evaluations start at a 10 percent sample, so raise the sampling and adjust the filters if the signal needs full coverage. Evaluations generated from your annotations carry an [alignment record](../evaluations/alignment), so how often the script agrees with a human reviewer is a measured number.
A signal escalates when its recent occurrences clear its own weekly rhythm, and [monitors](../monitors/overview) extend the same mechanism to saved searches and raw traffic metrics such as cost, latency, or cache hit rate. Either one opens an incident.
With [agent dispatch](../agent-dispatch/overview) configured, an escalating signal or an open incident wakes your coding agent with a prompt, a deep link, and sample failing traces. Latitude is the trigger and the context provider, not the agent runtime: the dispatched agent runs in your environment, with your credentials, against your repository. Direct integrations exist for [Claude Code](../agent-dispatch/claude-code), [Cursor](../agent-dispatch/cursor), and [Linear](../agent-dispatch/linear), with [webhooks](../agent-dispatch/webhooks) for everything else.
The dispatched agent investigates through the [MCP server](./mcp), reading the signal, slicing occurrences, and reading the failing conversations, then opens a pull request. Turn the failing traces behind the signal into a [dataset](../datasets/overview) and add a [regression test](../test-and-fix/regression-testing) that replays it in CI, so the fix has to pass before it merges and every later prompt change is checked against the same failure.
## Where humans stay
Two points of the loop are human by design. Annotations are the ground truth that evaluations are aligned against, and a person reviews every pull request before it merges. Everything between those points, finding examples, reconstructing context, and carrying trace ids between tools, is what the loop automates.
## Set it up
1. [Start tracing](../telemetry/start-tracing) one production agent.
2. Annotate a handful of real failures, or let [flaggers](../annotations/flaggers) do it.
3. Generate an [evaluation](../evaluations/overview) for the signal that matters most.
4. Add a [monitor](../monitors/overview) for any metric you cannot afford to miss.
5. Configure [agent dispatch](../agent-dispatch/overview) under **Settings → Integrations**.
Your coding agent can drive the whole workspace through the MCP server:
```bash theme={"theme":{"light":"github-light","dark":"github-dark"}}
claude mcp add --transport http latitude https://api.latitude.so/v1/mcp
```
For other coding agents, see the [MCP server docs](./mcp).